
Figure 3.
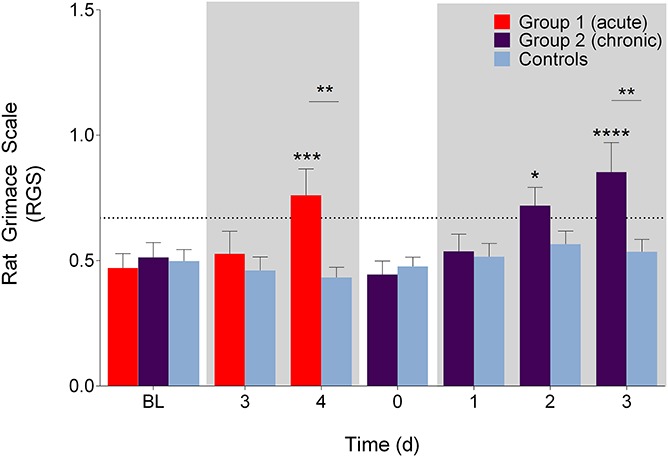
Rat Grimace Scale (video) scores during the acute and chronic phases. Significant increases from BL were observed on day 4 of the acute phase in group 1 and on days 2 and 3 of the chronic phase in group 2 (P < 0.05). Significant increases from controls were observed on day 4 during the acute phase and on days 2 and 3 during the chronic phase (P < 0.01). Broken horizontal line represents a derived analgesic intervention threshold.24 Shaded boxes represent DSS treatment phases. *P < 0.05. **P < 0.01. ***P < 0.001. ****P < 0.0001. Data presented as mean ± SEM. BL, baseline; DSS, dextran sulfate sodium.