
Figure 5.
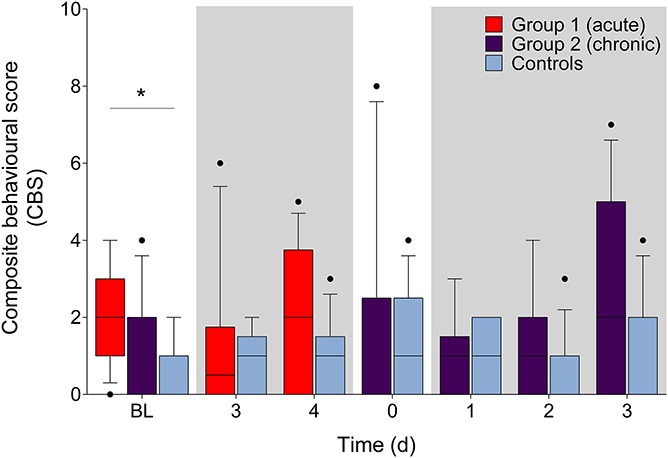
Summed frequency of 4 behaviours (back arch, stagger/fall, writhe, and twitch) evaluated during the acute phase and the chronic phase (shaded boxes). Differences between groups were identified at BL between group 1 and controls (P < 0.05). Differences within groups (from BL) were not observed. Shaded boxes represent when DSS treatment was given. Data presented as median (10–90 percentile). *P < 0.05. BL, baseline.