Supplemental Digital Content is available in the text
Keywords: chronic liver disease, diagnostic accuracy, liver fibrosis
Abstract
Background:
Red cell volume distribution width to platelet ratio (RPR), as a novel noninvasive assessment, is frequently investigated. However, the utility of RPR to evaluate the diagnostic accuracy of liver fibrosis remains controversial. We performed a meta-analysis to determine the diagnostic performance of RPR for detecting staging liver fibrosis in patients with chronic liver disease.
Methods:
MEDLINE, EMBASE, and Cochrane Library databases were systematically searched. Summary receiver operating characteristic curves (SROC), diagnostic odds ratios (DOR), pooled estimates of sensitivity, specificity, and likelihood ratios were used to assess the diagnostic accuracy of RPR. Meta-regression and subgroup analyses were also performed to identify factors that contributed to heterogeneity. The Quality Assessment for Studies of Diagnostic Accuracy Studies-2 tool was applied to assess the quality.
Results:
Fifteen studies with a total of 3346 patients were included in the meta-analysis. The area under the curve for SROC to summarize diagnostic accuracy of RPR for prediction of significant fibrosis, advanced fibrosis, and cirrhosis was 0.73 (standard error [SE] = 0.02), 0.83 (SE = 0.03), and 0.85 (SE = 0.04), respectively. Pooled DOR with corresponding 95% confidence interval (CI) was 4.93 (95% CI: 3.78–6.43), 10.27 (95% CI: 6.26–16.84), and 12.16 (95% CI: 5.85–25.28), respectively, using a random effects model. Meta-regression showed that length of liver biopsy specimen potentially contributed to heterogeneity. There was no significant publication bias observed across the eligible studies.
Conclusions:
In chronic liver disease patients, RPR presented a good performance for prediction of significant fibrosis, advanced fibrosis, and cirrhosis. More future trials are required for prospective validation.
1. Introduction
Liver fibrosis, the predominant characteristic of most types of chronic liver disease, is a pathological process of excessive accumulation of extracellular matrix proteins.[1] It is the main indication for liver transplantation and high risk of developing complications, leading to liver failure and hepatocellular carcinoma associated with significant morbidity and mortality.[2,3] Globally, chronic viral infections (hepatitis B and C), alcohol abuse, nonalcoholic fatty liver disease (NAFLD), and nonalcoholic steatohepatitis are main pathogenic factors of liver fibrosis.[4–6] Precise definition of the severity of liver fibrosis is an urgent need to strengthen early detection and provide timely therapeutic strategy.
Liver biopsy (LB) was recommend to determine the degree of fibrosis, as hepatic histology can assist with the decision to start treatment and monitor treatment effects.[7] LB with subsequent histological analysis has been considered as the reference standard for assessing the histologic stage of fibrosis for decades,[8] with reported risk of hospitalization of 1% to 5%, risk of severe complications of 0.57% and mortality 0.009% to 0.12%.[9–11] The invasive nature, cost, and the potentially serious complications make it hard for many patients to accept repeated LB to monitor the process of liver fibrosis.[12] The diagnostic accuracy of LB is also unavoidably influenced by sampling error and observer variability.[13]
Considering these issues, alternative noninvasive methods were explored to detect fibrosis. Liver stiffness with shear wave-based elastography methods, including transient elastography, point shear wave elastography, and two-dimensional shear wave elastography showed promise as noninvasive methods of testing for liver fibrosis, with relatively high cost and 5% to 10% failure rate due to the limited to referral liver centers.[14] Accordingly, a variety of noninvasive methods based on inexpensive laboratory tests were developed to predict liver fibrosis. Many serum markers are measured in routine laboratory tests but are not specific to the liver and can be released upon inflammation of other tissues. Combinations of markers have been established for clinical use. Aspartate aminotransferase-platelet index (APRI) and the fibrosis index based on the 4 factors (FIB-4) were widely applied in most clinical settings for assessing liver fibrosis,[15–17] which had not been fully applied in clinical practice.
Recently, red cell volume distribution width to platelet ratio (RPR), developed by Chen et al,[18] was a novel algorithm that exhibits good performance in assessing significant fibrosis and cirrhosis in chronic hepatitis B (CHB). Nevertheless, with the development of follow-up research about RPR in various kinds of liver disease patients, the applicability and accuracy of RPR for detecting staging liver fibrosis in chronic liver disease patients remains controversial. Therefore, we performed a meta-analysis to evaluate the evidence on diagnosis of RPR for prediction of staging liver fibrosis, for better use in clinical practice and further improvement of patient outcomes.
2. Methods
2.1. Ethics statement
All data sources and statistical analyses were based on previous published studies; thus, no ethical approval and patient consent were required.
2.2. Study search strategy
This research was performed in accordance with the PRISMA (Preferred Reporting Items for Systematic Reviews and Meta-Analyses)[19] search strategy. An electronic search was independently and systematically performed in PubMed, EMBASE, and Cochrane Library databases up to July 25, 2018 by 2 investigators. The literature search included the keywords and MeSH terms “liver cirrhosis,” “liver fibrosis,” “red blood cell distribution width to platelet ratio,” and “RPR.”
2.3. Study selection
Two investigators independently determined study eligibility by reviewing and retrieving individual citations by titles or/and abstracts, and subsequently the full texts. Any discrepancies in the study regarding eligibility were resolved by consensus, and a final decision was made by Na Wang. Studies in this review were included if they met the following inclusion criteria: human studies with participants ≥18 years of age; the study evaluated the performance of RPR for staging fibrosis in chronic hepatitis patients, with the initial diagnosis of CHB, chronic hepatitis C, alcoholic hepatitis, primary biliary cirrhosis, autoimmune hepatitis, or non-alcoholic fatty liver disease; LB was used as a reference standard for assessing fibrosis; the study included a total number of at least 50 patients; data could be calculated for constructing 2 × 2 contingency tables of test performance; and the journals from our literature search could be searched in Journal Citation Reports. Studies were excluded from the current study if patients had previous antiviral therapy history; patients had hepatocellular carcinoma or other types of cancer; patients were co-coinfected with HIV; articles were duplicated or not based on original studies, such as reviews, commentaries, and conference abstracts; and the studies written in languages other than English.
2.4. Data extraction and quality assessment
Two reviewers independently searched prespecified data parameters in each study for the following variables: first author, year of publication, study location, study design, etiology, number of participants, percentage of males, median/mean age, scoring system, length of LB, alanine aminotransferase (ALT), aspartate aminotransferase (AST), red cell volume distribution width (RDW), and platelet (PLT). The diagnostic characteristics such as true positive (TP), false positive (FP), true negative (TN), and false negative (FN) of each study based on the reported sensitivity, specificity, positive predictive value, and negative predictive value were calculated for constructing 2 × 2 contingency tables. We also contacted study authors by e-mail to obtain additional data if only the area under the curve (AUC) data without a 2 × 2 table data were presented. In case of no reply, the study was excluded.
The Quality Assessment of Diagnostic Accuracy Studies (QUADAS-2) tool was recommended to assess the methodological quality and internal and external validity of diagnostic accuracy studies, including 4 key domains: patient selection, index test, reference standard, and flow and timing, with each item judged as “yes,” “no,” or “unclear.” Any signaling question that was answered “no” or “unclear” response to a signaling question indicated a high or unclear risk of bias, respectively.[20] The result of QUADAS-2 was presented by the software Review Manager (version 5.3, The Nordic Cochrane Centre, Copenhagen, Denmark).
2.5. Definition of staging liver fibrosis and biomarkers
Multiple staging systems can be used to evaluate fibrosis in chronic liver diseases.[21] In our study, significant fibrosis, advanced fibrosis, and cirrhosis were defined as METAVIR,[22] Brunt,[23] Batts-Ludwig, or Scheuer[24] scoring system stages F2-F4, F3-F4, and F4 or as Ishak[25] scoring system stages F3-F6, F4-F6, and F5-F6, which were consistent with other studies.[17,26] RPR, FIB-4, and APRI were calculated as previously described: RPR = RDW (%)/PLT(109/L); FIB-4 = age (years) × AST (IU/L)/PLT (109/L) × [ALT1/2(IU/L)]; and APRI = AST (ULN)/PLT (109/L).
2.6. Statistical analysis
TP, TN, FP, and FN in each study were analyzed using the software Meta-DiSc (version 1.4, the Unit of Clinical Biostatistics team of the Ramón y Cajal Hospital, Madrid, Spain)[27] to assess the pooled sensitivity, specificity, positive likelihood ratio (PLR), negative likelihood ratio (NLR), and diagnostic odds ratios (DOR) with corresponding 95% confidence intervals (CI) for the included studies. These accuracy indexes were also presented as forest plots. The summary statistical data were calculated by a random effects model (DerSimonian and Laird method) with a corresponding test of heterogeneity, or else measured by a fixed effects model (Mantel-Haenszel method). Summary receiver operating characteristic curves (SROC) was constructed to describe the relationship between sensitivity and specificity. Simultaneously, the AUC value of SROC was calculated to measure the diagnostic performance of RPR for detecting significant fibrosis, advanced fibrosis, and cirrhosis, and defined as a useful predictor if AUC ≥0.70.[28] If more than 1 cutoff values were used to determine fibrosis in an individual study, the one close to the common cutoff value was selected as the cutoff value included in the meta-analysis.[26]
Heterogeneity among the studies caused by threshold effect was quantified using the Spearman correlation coefficient and probability value between the logit of sensitivity and logit of 1—specificity.[29] Nonthreshold effect was assessed by Cochran's Q test and the inconsistency index (I2) index. I2 value > 50% or I2 value > 25% with P < .01 indicated substantial heterogeneity.[30] The heterogeneity test, assessment of threshold effect, diagnostic performance, as well as meta-regression and subgroup analyses were also performed using Meta-DiSc (version 1.4) software to identify factors that contributed to heterogeneity.[27]
In addition, publication bias was assessed with Deeks funnel plot asymmetry test using Stata (version 12.0) statistical software (STATA Corporation, College Station, TX).[31]
3. Results
3.1. Study characteristics and quality assessment
A total of 136 relevant articles were identified from various databases based on the search strategies. One hundred six records were retained after removing duplications. Excluding commentary abstracts, reviews, and screening titles and abstracts, 29 full-text articles were downloaded for careful screening in accordance with the eligibility criteria. Ultimately, 13 articles (containing 15 studies) involving 3346 patients published between 2013 and 2018 were reserved for meta-analysis to assess the diagnostic accuracy of RPR for predicting staging liver fibrosis in chronic hepatitis patients. Among these, Zhu et al[32] performed 3 subgroup studies. The flowchart of the literature screening was shown in Figure 1. The main characteristics of each study were presented in Table 1. The overall prevalence of liver significant fibrosis, advanced fibrosis, and cirrhosis was 52.5% (21.7–85.8%), 40.7% (9.6–68.8%), and 28.0% (4.8–44.2%). Of the staging fibrosis systems in these including studies, 6 studies used METAVIR, 3 studies Scheuer, 3 studies Batts and Ludwig, 2 study Ishak, and 1 study Brunt's criteria. Ten studies included hepatitis B virus (HBV) mono-infected patients,[18,32–38] 1 study included hepatitis C virus (HCV) mono-infected patients,[39] 1 study included PBC,[39] 1 study included NAFLD,[41] and 2 studies included abovementioned and other factors simultaneously.[42,43] The quality assessment according to the QUADAS-2 was presented in Figure 2.
Figure 1.
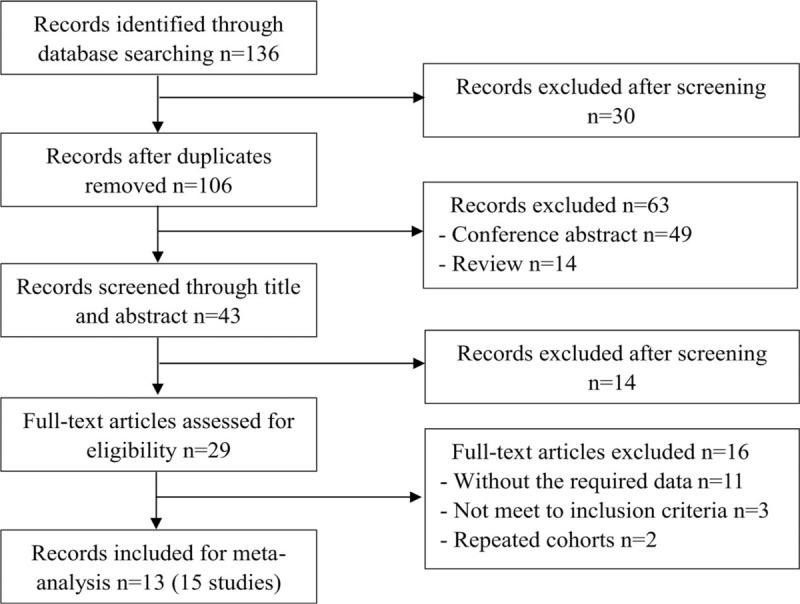
Study flow diagram.
Table 1.
Characteristics of included studies.
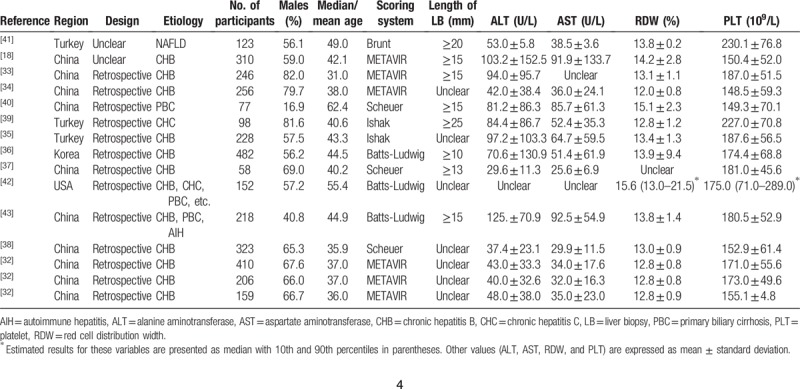
Figure 2.
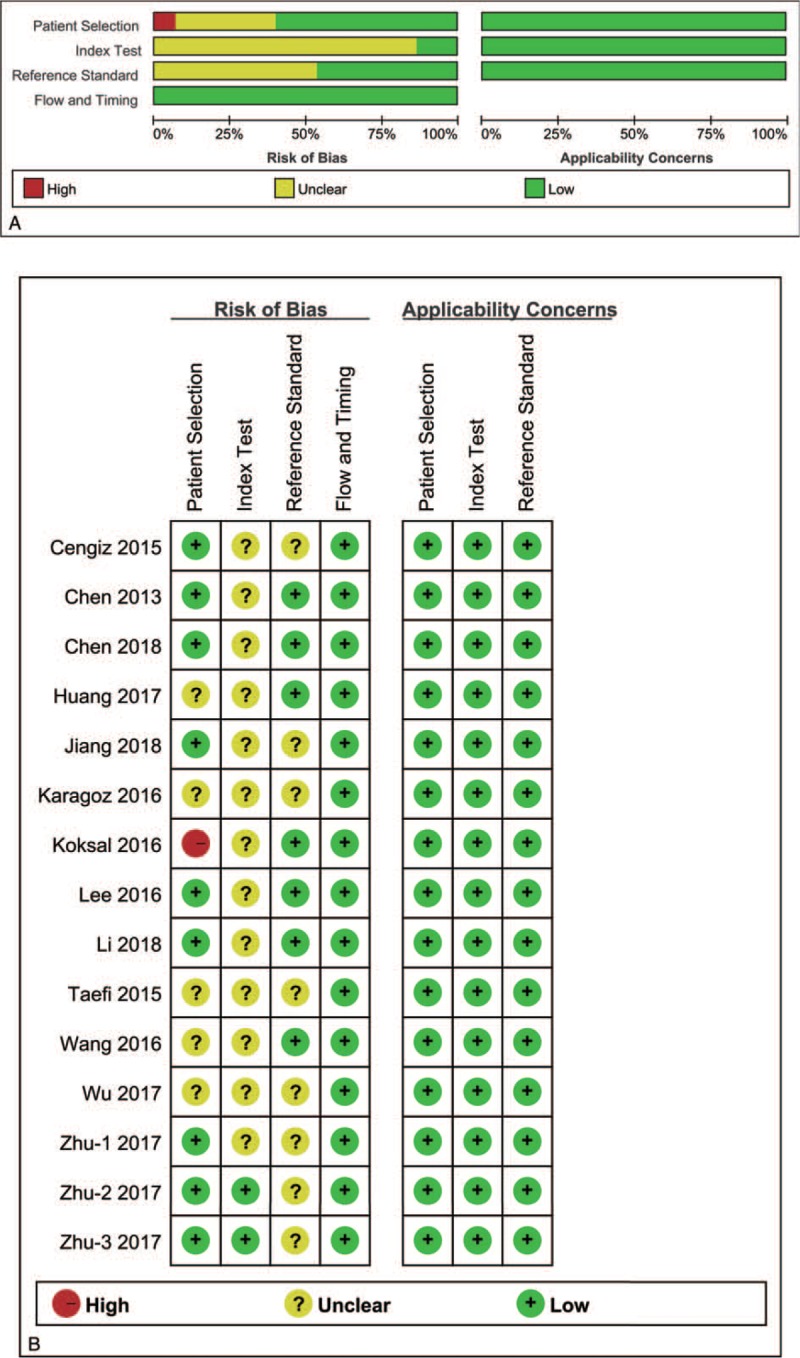
Methodological quality. (A) Individual study graph, (B) study summary.
3.2. Diagnostic accuracy of RPR for the prediction of significant fibrosis
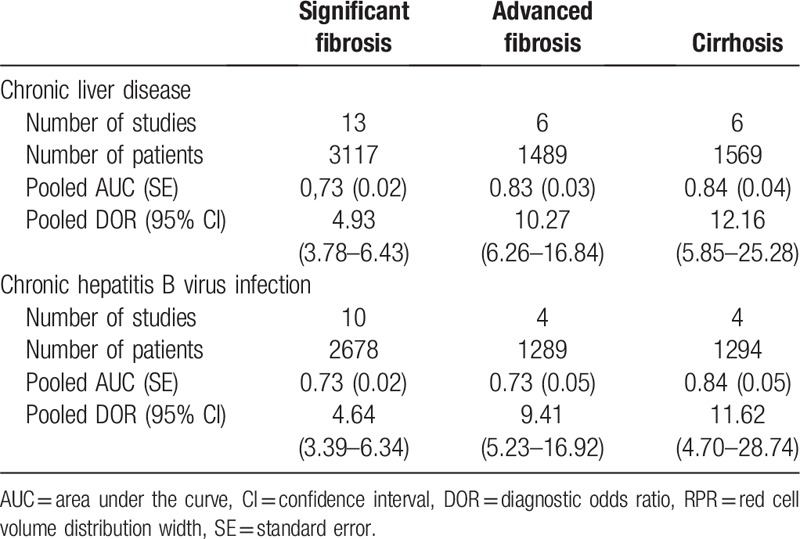
Thirteen studies enrolling 3117 patients were included in the meta-analysis to assess the performance of RPR for detecting significant fibrosis. The key diagnostic values of these individual studies are summarized in Table 2. In these studies, the mean prevalence of significant fibrosis was 43.5%, ranging from 21.7% to 85.8%. The mean AUC value of RPR for detecting significant fibrosis was 0.71 (range: 0.64–0.83). We performed SROC to summarize the diagnosis accuracy: the AUC was 0.73 (standard error [SE] = 0.02) with Q∗ of 0.68 (SE = 0.02) (Fig. 3A). The pooled DOR was 4.93 (95% CI: 3.78–6.43) using a random effects model. Moderate heterogeneity was observed in the analysis of the significant fibrosis stage (Q = 24.99, I2 = 48.0%, P = .02). (Fig. 3B). On account of the threshold effect (Spearman correlation coefficient: 0.76, P = .003), the pooled sensitivities and specificities of RPR at various cutoff values were conducted to distinguish significant fibrosis (Supplemental Table 1). Univariate meta-regression was also performed to explore the potential sources of methodological heterogeneity: etiology, region, median/mean age, percentage of males, scoring system, sample sizes, length of LB, ALT, AST, RDW, and PLT. These hypothesized factors of heterogeneity could not be explained, except length of LB (P = .02) (Supplemental Table 2). Therefore, subgroup analysis about length of LB (≥10 mm vs. unclear) were performed to verify the source of heterogeneity. As expected, the heterogeneity was decreased significantly (I2 = 0.0%, P = .65 vs. I2 = 39.0%, P = .14) and diagnostic accuracy was increased (AUC 0.78, DOR 7.05 vs. AUC 0.70, DOR 3.69). Meanwhile, considering HBV as a major etiology, we performed subgroup analysis in CHB individuals, the AUC was 0.73 (SE = 0.02) with Q∗ of 0.68 (SE = 0.02) and the summary DOR was 4.64 (95% CI: 3.39–6.34) using a random effects model (Q = 20.95, I2 = 57.0%, P = .01) (Table 3). In addition, Deeks funnel plot demonstrated that there was no publication bias for RPR for detecting significant fibrosis with P = .43 (Supplemental Figure 1).
Table 2.
Diagnostic values of RPR to predict liver fibrosis in individual studies.
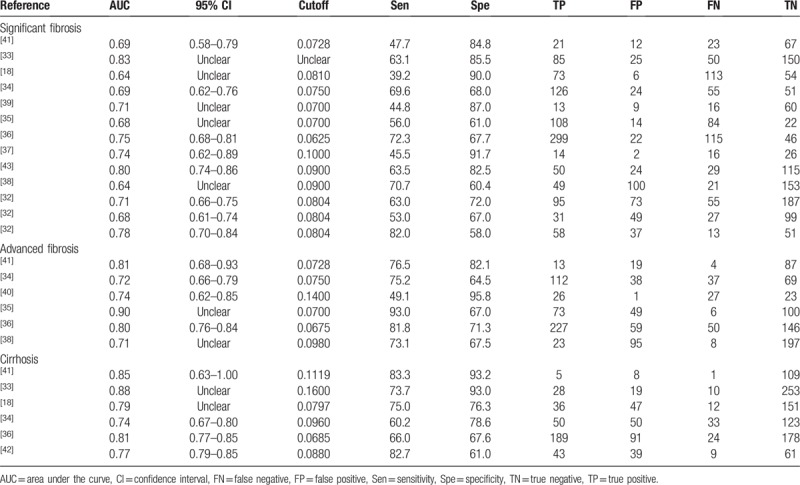
Figure 3.
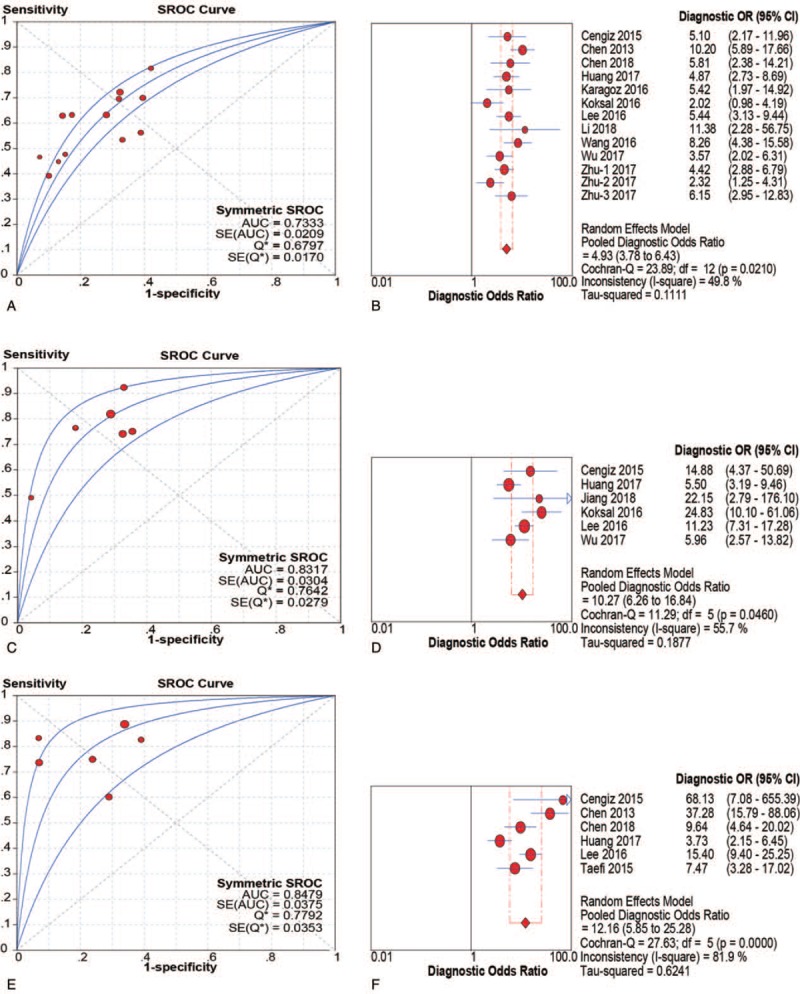
SROC and DOR of RPR for prediction of significant fibrosis, advanced fibrosis and cirrhosis. (A and B) SROC and DOR of RPR for prediction of significant fibrosis; (C and D) SROC and DOR of RPR for prediction of advanced fibrosis; (E and F) SROC and DOR of RPR for prediction of cirrhosis. DOR = diagnostic odds ratios, RPR = red cell volume distribution width to platelet ratio, SROC = summary receiver operating characteristic curve.
Table 3.
Diagnostic values of RPR for detecting significant fibrosis, advanced fibrosis, and cirrhosis in chronic liver disease patients.
3.3. Diagnostic accuracy of RPR for the prediction of advanced fibrosis
Six studies (n = 1489) were included in the pooled diagnostic assessment of the performance of RPR for predicting advanced fibrosis. The key diagnostic values of these individual studies are summarized in Table 2. In these studies, the mean prevalence of advanced fibrosis was 46.1%, ranging from 9.5% to 68.8%. The mean AUC value of RPR for detecting advanced fibrosis was 0.77 (range: 0.71–0.90). There was no notable threshold effect (Spearman correlation coefficient: 0.37, P = .47) in the 6 studies included in the meta-analysis. The pooled sensitivity and specificity were 0.78 (95% CI: 0.75–0.81) and 0.70 (95% CI: 0.67–0.73), respectively; the pooled PLR was 2.70 (95% CI: 2.23–3.27) and the pooled NLR was 0.31 (95% CI: 0.21–0.47) (Fig. 4). We performed SROC to summarize the diagnosis accuracy: the AUC was 0.83 (SE = 0.03) with Q∗ of 0.69 (SE = 0.03) (Fig. 3C). The pooled DOR was 10.27 (95% CI: 6.26–16.84) using a random effects model. Moderate heterogeneity was observed in the analysis of the significant fibrosis stage (Q = 11.29, I2 = 55.7%, P = .04) (Fig. 3D). Univariate meta-regression was also performed to explore the potential sources of methodological heterogeneity: etiology, region, median/mean age, percentage of males, sample sizes, scoring system, length of LB, ALT, AST, RDW, and PLT. These hypothesized factors of heterogeneity could not be explained with P < .05 (Supplemental Table 2). In the subgroup analysis of CHB individuals, the pooled sensitivity and specificity were 0.81 (95% CI: 0.78–0.84) and 0.68 (95% CI: 0.65–0.71), respectively. The pooled PLR was 2.53 (95% CI: 2.19–2.93) and the pooled NLR was 0.28 (95% CI: 0.18–0.42). The AUC was 0.73 (SE = 0.05) with Q∗ of 0.68 (SE = 0.04) and the summary DOR was 9.41 (95% CI: 5.23–16.92) using a random effects model (Table 3). In addition, Deeks funnel plot demonstrated that there was no publication bias for RPR for detecting advanced fibrosis with P = .75 (Supplemental Figure 1).
Figure 4.
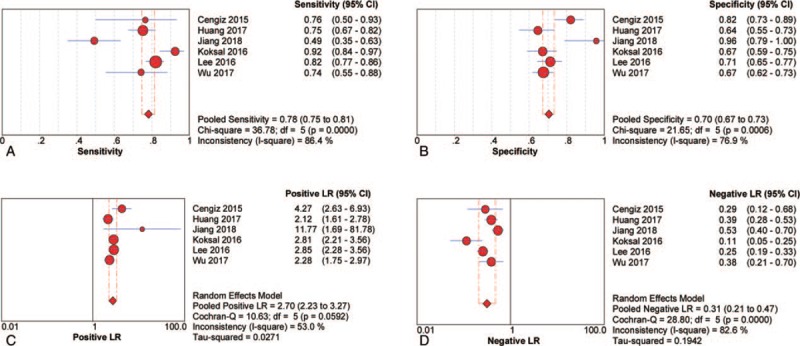
Sensitivity, specificity, positive LR and negative LR of RPR for prediction advanced fibrosis. (A) Sensitivity; (B) specificity; (C) positive LR; (D) negative LR. CI = confidence interval, LR = likelihood ratio, RPR = red cell volume distribution width to platelet ratio.
3.4. Diagnostic accuracy of RPR for the prediction of cirrhosis
Six studies with 1569 participants were included in the pooled diagnostic assessment of the performance of RPR for predicting cirrhosis. The key diagnostic values of these individual studies are summarized in Table 2. In these studies, the mean prevalence of cirrhosis was 26.0%, ranging from 4.9% to 56.5%, the mean AUC value of RPR for detecting cirrhosis was 0.80 (range: 0.77–0.88). There was no notable threshold effect (Spearman correlation coefficient: 0.14, P = .79) in this meta-analysis. The pooled sensitivity and specificity were 0.80 (95% CI: 0.76–0.83) and 0.78 (95% CI: 0.75–0.80), respectively. The pooled PLR was 3.73 (95% CI: 2.46–5.66) and the pooled NLR was 0.30 (95% CI: 0.18–0.48) (Fig. 5). We performed SROC to summarize the diagnosis accuracy: the AUC was 0.85 (SE = 0.04) with Q∗ of 0.78 (SE = 0.04) (Fig. 3E). The pooled DOR was 12.16 (95% CI: 5.85–25.28) using a random effects model. Moderate heterogeneity was observed in the analysis of the significant fibrosis stage (Q = 27.63, I2 = 81.9%, P < .001) (Fig. 3F). Univariate meta-regression was also performed to explore the potential sources of methodological heterogeneity: etiology, region, median/mean age, percentage of males, sample sizes, scoring system, length of LB, RDW, and PLT. These hypothesized factors of heterogeneity could not be explained with P < .05 (Supplemental Table 2). In the subgroup analysis of CHB individuals, the pooled sensitivity and specificity were 0.79 (95% CI: 0.75–0.83) and 0.77 (95% CI: 0.74–0.80), respectively. The pooled PLR was 3.53 (95% CI: 2.17–5.75) and the pooled NLR was 0.31 (95% CI: 0.17–0.57). The summary DOR was 11.62 (95% CI: 4.70–28.74) using a random effects model and AUC was 0.84 (SE = 0.05) with Q∗ of 0.77 (SE = 0.05) (Table 3). In addition, Deeks funnel plot demonstrated that there was no publication bias for RPR for detecting cirrhosis with P = .70 (Supplemental Figure 1).
Figure 5.
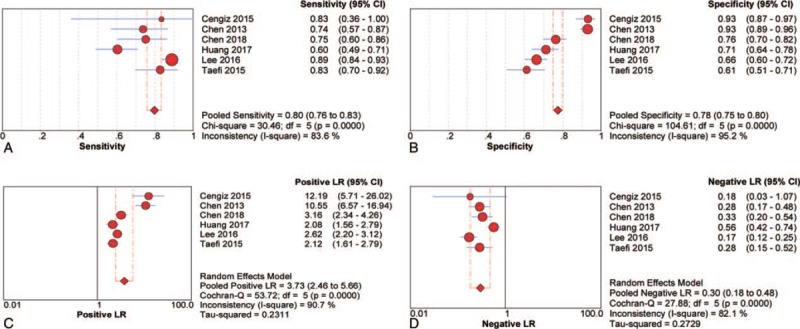
Sensitivity, specificity, positive LR and negative LR of RPR for prediction cirrhosis. (A) Sensitivity; (B) specificity; (C) positive LR; (D) negative LR. CI = confidence interval, LR = likelihood ratio, RPR = red cell volume distribution width to platelet ratio.
3.5. Diagnostic accuracy of RPR, FIB-4, and APRI for the prediction of staging liver fibrosis
Nine studies (n = 2330) were simultaneously described RPR, FIB-4, and APRI for the prediction of significant fibrosis (Supplemental Table 3). In the same individuals, the summary AUCs of RPR, FIB-4, and APRI were 0.73, 0.73, and 0.71. The summary DORs of RPR, FIB-4, and APRI were 4.43 (95% CI: 3.24–6.07, I2 = 49.9%, P = .04), 4.78 (95% CI 3.56–6.42, I2 = 44.5%, P = .07), and 4.01 (95% CI: 3.12–5.14, I2 = 19.0%, P = .27), respectively, for diagnosing significant fibrosis, with the summary specificity (0.70, 0.70, and 0.52), respectively. Four studies (n = 1289) were simultaneously described RPR, FIB-4, and APRI for the prediction of advanced fibrosis (Supplemental Table 3). The summary AUCs of RPR, FIB-4, and APRI were 0.73, 0.79, and 0.65, respectively. The summary DORs of RPR, FIB-4, and APRI were 9.41 (95% CI 5.23–16.92, I2 = 70.1%, P = .02), 11.48 (95% CI 7.33–17.98, I2 = 40.4%, P = .17), and 5.61 (95% CI 2.50–12.62, I2 = 84.3%, P < .001). Three studies (n = 984) were simultaneously described RPR, FIB-4, and APRI for the prediction of cirrhosis (Supplemental Table 3). The summary AUCs of RPR, FIB-4, and APRI were 0.78, 0.92, and 0.69. The summary DORs of RPR, FIB-4, and APRI were 8.21 (95% CI: 3.33–20.26, I2 = 86.1%, P < .001), 8.61 (95% CI: 6.26–11.84, I2 = 0.0%, P = .91), and 3.34 (95% CI: 2.23–5.00, I2 = 33.1%, P = .22), respectively.
4. Discussion
In most forms of chronic liver disease, liver cirrhosis is considered as a common and growing public health issues, with an increasing burden of disease-associated morbidity and mortality. Early detection and assessment of liver fibrosis are essential for disease progression and therapeutic judgment. Noninvasive, accurate, inexpensive, and convenient operation methods have been investigated for assessment of the diagnostic accuracy of staging liver fibrosis in present medical practice worldwide. In this study, we first conducted a meta-analysis to determine the diagnostic accuracy of RPR for the prediction of liver fibrosis. The summarized results suggested that RPR has good accuracy for detecting significant fibrosis, advanced fibrosis, and cirrhosis in chronic liver disease patients (AUC: 0.73, 0.83, and 0.85, respectively). The length of LB contributed to heterogeneity, indicating the unavoidable drawbacks, which highlight that noninvasive assessment of liver fibrosis is of increasing importance. Among the included studies, a proportion of them focused on Asian region where chronic HBV infection is ubiquitous, with approximately 10% of chronic HBV carriers.[44] In the subgroup analysis of CHB individuals, the AUCs of RPR for prediction of significant fibrosis, advanced fibrosis, and cirrhosis were 0.74, 0.73, and 0.84, respectively. These subgroup results of staging liver fibrosis were similar to the overall results, except the staging of advanced fibrosis. RPR may play a critical role in the diagnosis of liver fibrosis in NAFLD and PBC. Jiang et al[40] investigated diagnostic performance of RPR in primary biliary cholangitis patients, the value of AUC, sensitivity, and specificity were 0.74%, 49.1% and 95.8%, respectively (cutoff value, 0.14), Cengiz and Ozenirler[41] conducted an observational study to assess RPR in NAFLD, as the fibrosis scores progressed, the median values of RPR increased, the AUC of RPR was 0.81 (95% CI, 0.68–0.93) for advanced fibrosis with sensitivity of 76.47% and specificity of 82.08% (cutoff value, 0.073). However, meta-regression did not suggest that the heterogeneity was related to this. Further confirmation may be necessary in this stage.
The differences in cutoff values in the studies included in the meta-analysis were always susceptible to the threshold effect. For staging significant fibrosis, on account of the threshold effect based on cutoff values (range: 0.0625–0.10), we could not attempt to pool the effect values of sensitivity, specificity, PLR, and NLR. For staging advanced fibrosis, although without a notable threshold effect, we found when omitting each 1 study at a time, the summary AUC was under 0.80, strikingly different from others (cutoff values of range 0.0675–0.10), if removing 1 of the studies (cutoff value, 0.14).[40] Meanwhile, the cutoff values from different original studies were overlapped for detecting significant fibrosis, advanced fibrosis, and cirrhosis in chronic liver disease patients, ranging from 0.0625 to 0.01, 0.0675 to 0.14, and 0.0685 to 0.16, respectively. Therefore, it was indicated that cutoff values might affect diagnostic accuracy and cause the potential heterogeneity.
Adoption of an algorithmic approach or combination of multiple indices could be associated with somewhat higher diagnostic accuracy than using a single index.[45] Xiao et al[17] performed a meta-analysis suggests that APRI and FIB-4 can identify chronic HBV infection fibrosis with a moderate sensitivity and accuracy. The summary AUCs of APRI and FIB-4 for the diagnosis of significant fibrosis, advanced fibrosis, and cirrhosis were 0.74 and 0.78 (P = .06), 0.73 and 0.82 (P = .02), and 0.73 and 0.84 (P = .01), respectively.[17] In our study, in the same individuals, we performed a meta-analysis of RPR, FIB-4, and APRI for detecting liver fibrosis at 3 stages. We found RPR had almost the same diagnostic accuracy as FIB-4 and APRI in staging significant fibrosis. As an initial screening test, RPR was superior to APRI and FIB-4, because RPR was only based on hematological parameters (RDW and PLT), without other blood biochemical parameters (ALT and AST), which were APRI and FIB-4 needed. Meanwhile, the summary specificity of RPR was not lower than other 2 indices. In advanced fibrosis and cirrhosis, the summary AUCs of RPR and APRI were slightly lower than that of FIB-4, and RPR was superior to APRI. Due to the small sample size, these summarized results need further evidence to demonstrate the diagnostic accuracy.
In addition, we focused on the diagnostic performances without comparing the cost benefits or the efficiency, which may require specific overviews. Because the cost-effectiveness of noninvasive tests as alternatives to LB was not in-depth, which may influence clinical outcomes, even lead to heterogeneity. Moreover, despite without significant publication-related bias, we could not exclude that potentially eligible abstracts may lead to the possibility of publication bias, such as language restriction, negative results, and so on. The unbalance of geographical distribution, without valid data in European countries, may bias the results. To some extent, further limitations are caused by the lack of prospective nature of this study and small patient numbers for some sites and etiologies.
In conclusion, early and efficient diagnosis of liver fibrosis is of great significance to the prognosis of liver fibrosis. RPR has a good performance for the noninvasive assessment of liver fibrosis in chronic liver disease patients. Further studies are required for prospective validation.
Author contributions
Conceptualization: Ying Cai.
Data curation: Ying Cai, Dina Liu, Yu Sha.
Formal analysis: Ying Cai.
Funding acquisition: Jing Cui, Hengyu Zhou, Ni Tang, Na Wang, Jie Xia.
Investigation: Ying Cai, Dina Liu, Yu Sha, Hengyu Zhou.
Methodology: Ying Cai, Jing Cui, Hengyu Zhou.
Project administration: Ying Cai.
Software: Ying Cai.
Supervision: Na Wang, Ailong Huang, Jie Xia.
Validation: Na Wang, Jie Xia.
Writing – original draft: ying cai.
writing – review & editing: Na Wang, Ailong Huang, Jie Xia.
Jie Xia orcid: 0000-0003-4574-9376.
Supplementary Material
Footnotes
Abbreviations: ALT = alanine aminotransferase, APRI = aspartate aminotransferase-platelet index, AST = aspartate aminotransferase, AUC = area under the curve, CHB = chronic hepatitis B, CI = confidence interval, DOR = diagnostic odds ratios, FIB-4 = fibrosis index based on the four factors, FN = false negative, FP = false positive, HBV = hepatitis B virus, HCV = hepatitis C virus, LB = liver biopsy, NAFLD = nonalcoholic fatty liver disease, NLR = negative likelihood ratio, PBC = primary biliary cholangitis, PLR = positive likelihood ratio, PLT = platelet, QUADAS = Quality Assessment of Diagnostic Accuracy Studies, RDW = red cell volume distribution width, RPR = red cell volume distribution width to platelet ratio, SE = standard error, SROC = summary receiver operating characteristic curves, TN = true negative, TP = true positive.
JX and NW contributed equally to this work.
This study was funded by Chongqing Basic and Frontier Research Project (cstc2016jcyjA0206), Chinese National Natural Science Foundation Project (No. 81802454), Medical Research Project of Chongqing Health and Family Planning Commission (2016MSXM026), Program for Innovation Team of Higher Education in Chongqing (CXTDX201601015), and Chongqing Yuzhong District Science and Technology Plan (20170413).
The authors have no conflicts of interest to disclose.
Supplemental Digital Content is available for this article.
References
- [1].Bataller R, Brenner DA. Liver fibrosis. J Clin Invest 2005;115:209–18. [DOI] [PMC free article] [PubMed] [Google Scholar]
- [2].O’Leary JG, Lepe R, Davis GL. Indications for liver transplantation. Gastroenterology 2008;134:1764–76. [DOI] [PubMed] [Google Scholar]
- [3].Shiha G, Ibrahim A, Helmy A, et al. Asian-Pacific Association for the Study of the Liver (APASL) consensus guidelines on invasive and non-invasive assessment of hepatic fibrosis: a 2016 update. Hepatol Int 2017;11:1–30. [DOI] [PubMed] [Google Scholar]
- [4].Ott JJ, Stevens GA, Groeger J, et al. Global epidemiology of hepatitis B virus infection: new estimates of age-specific HBsAg seroprevalence and endemicity. Vaccine 2012;30:2212–9. [DOI] [PubMed] [Google Scholar]
- [5].Fernandez CC, Lens S, Llop E, et al. Treatment of hepatitis C virus infection in patients with cirrhosis and predictive value of model for end-stage liver disease: analysis of data from the Hepa-C registry. Hepatology 2017;65:1810–22. [DOI] [PubMed] [Google Scholar]
- [6].Younossi Z, Henry L. Contribution of alcoholic and nonalcoholic fatty liver disease to the burden of liver-related morbidity and mortality. Gastroenterology 2016;150:1778–85. [DOI] [PubMed] [Google Scholar]
- [7].European Association For The Study Of The Liver. EASL clinical practice guidelines: management of chronic hepatitis B virus infection. J Hepatol 2012;57:167–85. [DOI] [PubMed] [Google Scholar]
- [8].Afdhal NH, Nunes D. Evaluation of liver fibrosis: a concise review. Am J Gastroenterol 2004;99:1160–74. [DOI] [PubMed] [Google Scholar]
- [9].Cadranel JF, Rufat P, Degos F. Practices of liver biopsy in France: results of a prospective nationwide survey. For the Group of Epidemiology of the French Association for the Study of the Liver (AFEF). Hepatology 2000;32:477–81. [DOI] [PubMed] [Google Scholar]
- [10].Terjung B, Lemnitzer I, Dumoulin FL, et al. Bleeding complications after percutaneous liver biopsy. An analysis of risk factors. Digestion 2003;67:138–45. [DOI] [PubMed] [Google Scholar]
- [11].West J, Card TR. Reduced mortality rates following elective percutaneous liver biopsies. Gastroenterology 2010;139:1230–7. [DOI] [PubMed] [Google Scholar]
- [12].Castera L, Negre I, Samii K, et al. Pain experienced during percutaneous liver biopsy. Hepatology 1999;30:1529–30. [DOI] [PubMed] [Google Scholar]
- [13].Ratziu V, Charlotte F, Heurtier A, et al. Sampling variability of liver biopsy in nonalcoholic fatty liver disease. Gastroenterology 2005;128:1898–906. [DOI] [PubMed] [Google Scholar]
- [14].Herrmann E, de Ledinghen V, Cassinotto C, et al. Assessment of biopsy-proven liver fibrosis by two-dimensional shear wave elastography: an individual patient data-based meta-analysis. Hepatology 2018;67:260–72. [DOI] [PMC free article] [PubMed] [Google Scholar]
- [15].Wai CT, Greenson JK, Fontana RJ, et al. A simple noninvasive index can predict both significant fibrosis and cirrhosis in patients with chronic hepatitis C. Hepatology 2003;38:518–26. [DOI] [PubMed] [Google Scholar]
- [16].Teshale E, Lu M, Rupp LB, et al. APRI and FIB-4 are good predictors of the stage of liver fibrosis in chronic hepatitis B: the Chronic Hepatitis Cohort Study (CHeCS). J Viral Hepat 2014;21:917–20. [DOI] [PubMed] [Google Scholar]
- [17].Xiao G, Yang J, Yan L. Comparison of diagnostic accuracy of aspartate aminotransferase to platelet ratio index and fibrosis-4 index for detecting liver fibrosis in adult patients with chronic hepatitis B virus infection: a systemic review and meta-analysis. Hepatology 2015;61:292–302. [DOI] [PubMed] [Google Scholar]
- [18].Chen B, Ye B, Zhang J, et al. RDW to platelet ratio: a novel noninvasive index for predicting hepatic fibrosis and cirrhosis in chronic hepatitis B. PLoS One 2013;8:e68780. [DOI] [PMC free article] [PubMed] [Google Scholar]
- [19].Shamseer L, Moher D, Clarke M, et al. Preferred reporting items for systematic review and meta-analysis protocols (PRISMA-P) 2015: elaboration and explanation. BMJ 2015;350:g7647. [DOI] [PubMed] [Google Scholar]
- [20].Whiting PF, Rutjes AW, Westwood ME, et al. QUADAS-2: a revised tool for the quality assessment of diagnostic accuracy studies. Ann Intern Med 2011;155:529–36. [DOI] [PubMed] [Google Scholar]
- [21].Goodman ZD. Grading and staging systems for inflammation and fibrosis in chronic liver diseases. J Hepatol 2007;47:598–607. [DOI] [PubMed] [Google Scholar]
- [22].The French METAVIR Cooperative Study Group. Intraobserver and interobserver variations in liver biopsy interpretation in patients with chronic hepatitis C. Hepatology 1994;20:15–20. [PubMed] [Google Scholar]
- [23].Brunt EM, Janney CG, Di Bisceglie AM, et al. Nonalcoholic steatohepatitis: a proposal for grading and staging the histological lesions. Am J Gastroenterol 1999;94:2467–74. [DOI] [PubMed] [Google Scholar]
- [24].Scheuer PJ. Classification of chronic viral hepatitis: a need for reassessment. J Hepatol 1991;13:372–4. [DOI] [PubMed] [Google Scholar]
- [25].Ishak K, Baptista A, Bianchi L, et al. Histological grading and staging of chronic hepatitis. J Hepatol 1995;22:696–9. [DOI] [PubMed] [Google Scholar]
- [26].Li Y, Huang YS, Wang ZZ, et al. Systematic review with meta-analysis: the diagnostic accuracy of transient elastography for the staging of liver fibrosis in patients with chronic hepatitis B. Aliment Pharmacol Ther 2016;43:458–69. [DOI] [PubMed] [Google Scholar]
- [27].Zamora J, Abraira V, Muriel A, et al. Meta-DiSc: a software for meta-analysis of test accuracy data. BMC Med Res Methodol 2006;6:31. [DOI] [PMC free article] [PubMed] [Google Scholar]
- [28].Swets JA. Measuring the accuracy of diagnostic systems. Science 1988;240:1285–93. [DOI] [PubMed] [Google Scholar]
- [29].Arends LR, Hamza TH, van Houwelingen JC, et al. Bivariate random effects meta-analysis of ROC curves. Med Decis Making 2008;28:621–38. [DOI] [PubMed] [Google Scholar]
- [30].Higgins JP, Thompson SG, Deeks JJ, et al. Measuring inconsistency in meta-analyses. BMJ 2003;327:557–60. [DOI] [PMC free article] [PubMed] [Google Scholar]
- [31].Deeks JJ, Macaskill P, Irwig L. The performance of tests of publication bias and other sample size effects in systematic reviews of diagnostic test accuracy was assessed. J Clin Epidemiol 2005;58:882–93. [DOI] [PubMed] [Google Scholar]
- [32].Zhu MY, Zou X, Li Q, et al. A novel noninvasive algorithm for the assessment of liver fibrosis in patients with chronic hepatitis B virus infection. J Viral Hepat 2017;24:589–98. [DOI] [PubMed] [Google Scholar]
- [33].Chen YP, Hu XM, Liang XE, et al. Stepwise application of fibrosis index based on four factors, red cell distribution width-platelet ratio, and aspartate aminotransferase-platelet ratio for compensated hepatitis B fibrosis detection. J Gastroenterol Hepatol 2018;33:256–63. [DOI] [PubMed] [Google Scholar]
- [34].Huang R, Wang G, Tian C, et al. Gamma-glutamyl-transpeptidase to platelet ratio is not superior to APRI, FIB-4 and RPR for diagnosing liver fibrosis in CHB patients in China. Sci Rep 2017;7:8543. [DOI] [PMC free article] [PubMed] [Google Scholar]
- [35].Koksal AR, Alkim H, Boga S, et al. Effect of entecavir and tenofovir treatment on noninvasive fibrosis scores: which one is better? Am J Ther 2016;23:e429–38. [DOI] [PubMed] [Google Scholar]
- [36].Lee HW, Kang W, Kim BK, et al. Red cell volume distribution width-to-platelet ratio in assessment of liver fibrosis in patients with chronic hepatitis B. Liver Int 2016;36:24–30. [DOI] [PubMed] [Google Scholar]
- [37].Li X, Zheng S, Xu H, et al. Evaluation of non-invasive methods in hepatitis b virus (HBV)-infected patients with normal liver function. Int J Clin Exp Med 2018;11:792–8. [Google Scholar]
- [38].Wu X, Cai B, Su Z, et al. Aspartate transaminase to platelet ratio index and gamma-glutamyl transpeptidase-to-platelet ratio outweigh fibrosis index based on four factors and red cell distribution width-platelet ratio in diagnosing liver fibrosis and inflammation in chronic hepatitis B. J Clin Lab Anal 2018;32:e22341. [DOI] [PMC free article] [PubMed] [Google Scholar]
- [39].Karagoz E, Tanoglu A, Ulcay A, et al. Mean platelet volume and red cell distribution width to platelet ratio for predicting the severity of hepatic fibrosis in patients with chronic hepatitis C. Eur J Gastroenterol Hepatol 2016;28:744–8. [DOI] [PubMed] [Google Scholar]
- [40].Jiang X, Wang Y, Su Z, et al. Red blood cell distribution width to platelet ratio levels in assessment of histologic severity in patients with primary biliary cholangitis. Scand J Clin Lab Invest 2018;78:258–63. [DOI] [PubMed] [Google Scholar]
- [41].Cengiz M, Ozenirler S. Comparative diagnostic accuracy of red cell distribution width-to-platelet ratio versus noninvasive fibrosis scores for the diagnosis of liver fibrosis in biopsy-proven nonalcoholic fatty liver disease. Eur J Gastroenterol Hepatol 2015;27:1293–9. [DOI] [PubMed] [Google Scholar]
- [42].Taefi A, Huang CC, Kolli K, et al. Red cell distribution width to platelet ratio, a useful indicator of liver fibrosis in chronic hepatitis patients. Hepatol Int 2015;9:454–60. [DOI] [PubMed] [Google Scholar]
- [43].Wang H, Xu H, Qu L, et al. Red blood cell distribution width and globulin, noninvasive indicators of fibrosis and inflammation in chronic hepatitis patients. Eur J Gastroenterol Hepatol 2016;28:997–1002. [DOI] [PubMed] [Google Scholar]
- [44].Karagoz E, Ulcay A, Tanoglu A, et al. Clinical usefulness of mean platelet volume and red blood cell distribution width to platelet ratio for predicting the severity of hepatic fibrosis in chronic hepatitis B virus patients. Eur J Gastroenterol Hepatol 2014;26:1320–4. [DOI] [PubMed] [Google Scholar]
- [45].Chou R, Wasson N. Blood tests to diagnose fibrosis or cirrhosis in patients with chronic hepatitis C virus infection: a systematic review. Ann Intern Med 2013;158:807–20. [DOI] [PubMed] [Google Scholar]
Associated Data
This section collects any data citations, data availability statements, or supplementary materials included in this article.


