
Figure 3.
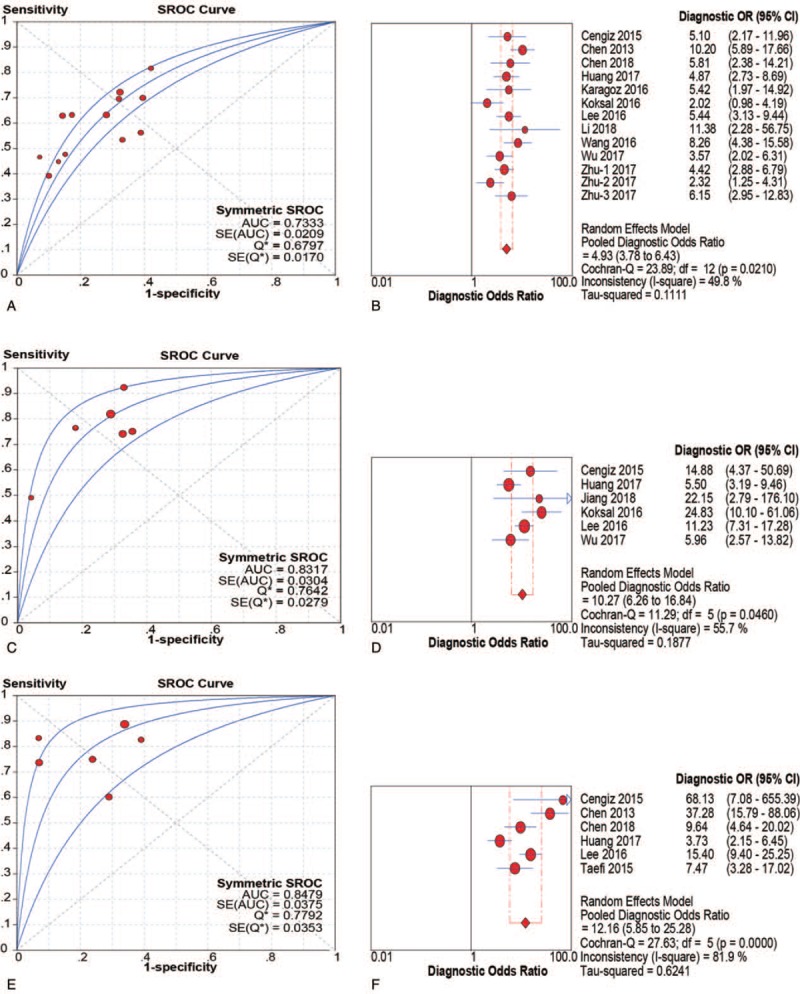
SROC and DOR of RPR for prediction of significant fibrosis, advanced fibrosis and cirrhosis. (A and B) SROC and DOR of RPR for prediction of significant fibrosis; (C and D) SROC and DOR of RPR for prediction of advanced fibrosis; (E and F) SROC and DOR of RPR for prediction of cirrhosis. DOR = diagnostic odds ratios, RPR = red cell volume distribution width to platelet ratio, SROC = summary receiver operating characteristic curve.