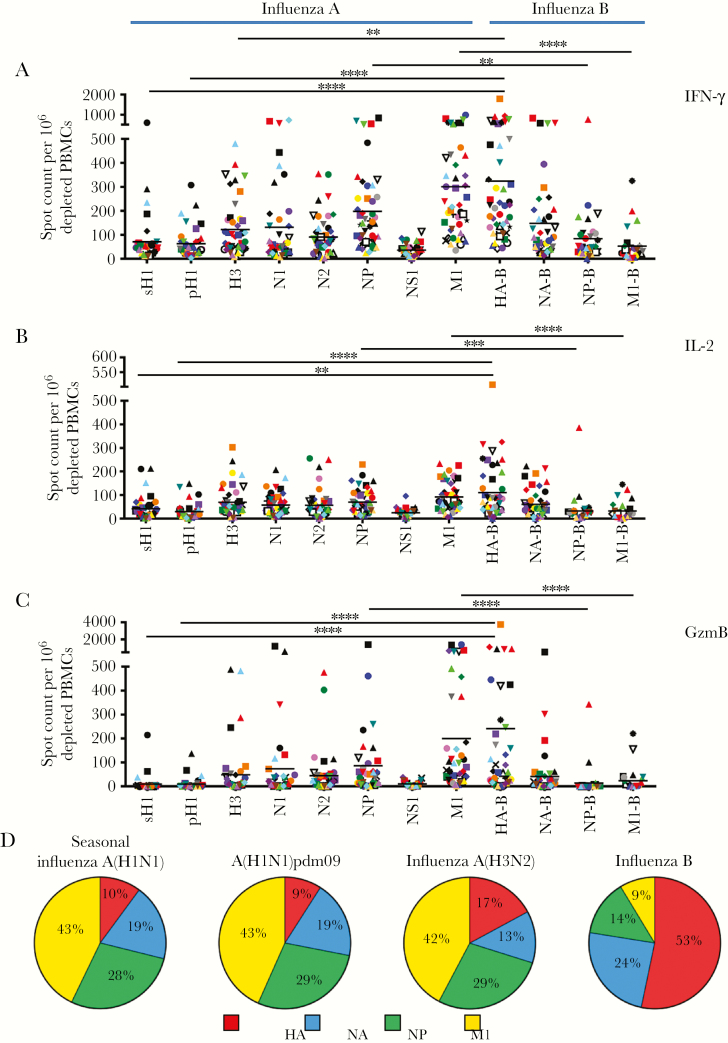
Figure 1.
A–C, Influenza virus–reactive CD4+ T cells secreting interferon γ (IFN-γ; A), interleukin 2 (IL-2; B), and granzyme B (GzmB; C) have diverse antigen specificity. Enzyme-linked immunospot (ELISPOT) analyses were performed following restimulation with peptide pools spanning the entire coding sequences of the sH1, pH1, H3, N1, N2, NP, NS1, M1, HA-B, NA-B, NP-B, and M1-B proteins (see Materials and Methods for descriptions of proteins). Responses are shown as the spot count per 106 CD8- and CD56-depleted peripheral blood mononuclear cells (PBMCs) with background subtracted. Donors are indicated by unique symbols (Supplementary Figure 1), with mean values designated by black lines. **P ≤ .01, ***P ≤ .001, and ****P ≤ .0001, by the Kruskal-Wallis test with the Dunn post hoc test, for differences between influenza A virus and corresponding influenza B virus proteins. D, Differences in immunodominance hierarchies among CD4+ T cells specific to influenza A and influenza B viruses. Each slice of the pie depicts the relative fraction of the CD4+ T-cell response dedicated to hemagglutinin (red), neuraminidase (blue), nucleoprotein (green), and matrix protein (yellow), based on IFN-γ ELISPOT values. The total number of cytokine spots for the indicated proteins within each virus ranged from approximately 600–700 spots per 106 CD8- and CD56-depleted PBMCs. A(H1N1)pdm09, 2009 pandemic influenza A(H1N1) virus.

