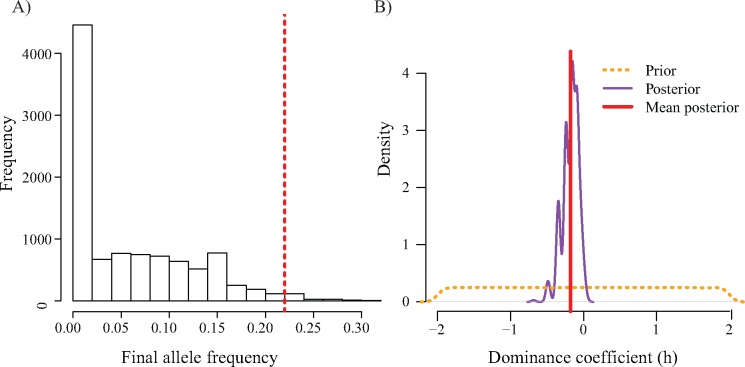
Fig. 6.
(A) Null distribution of allele frequencies based on the Yellowstone National Park wolf reintroduction demographic history. The dashed red line denotes the observed value, which corresponds to a P value of 0.018. (B) Prior and posterior distributions of the dominance (h) coefficient for the KB allele. The mean posterior value was −0.179 (95% HPD: −0.483, −0.0040).

