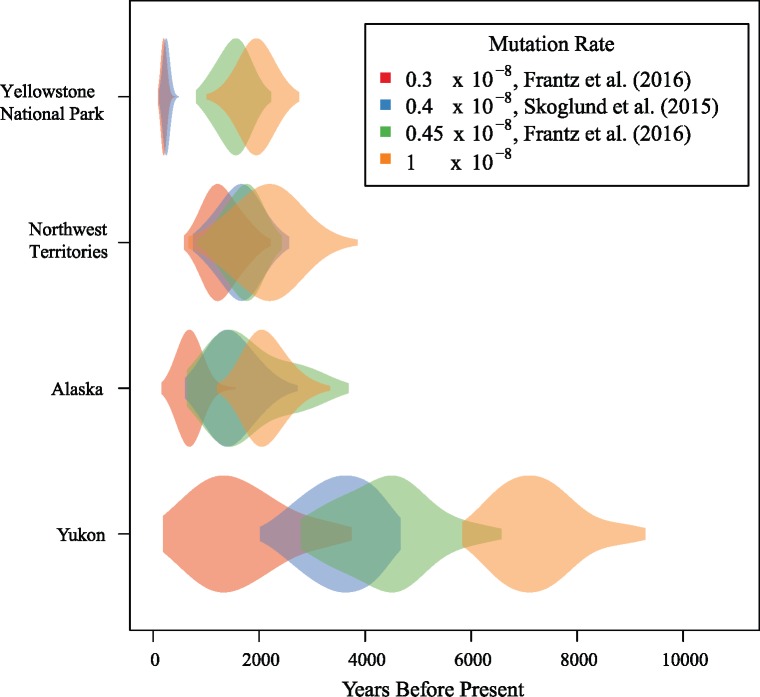
Fig. 8.
TMRCA estimates of the KB allele in the four North American populations using four different mutation rates assuming a generation time of 3 years. The violin plots are samples from the posterior distribution of TMRCAs drawn from a Markov chain Monte Carlo run for 50,000 iterations with a standard deviation of 10 for the proposal distribution. The locus includes 3 Mbp of flanking sequence around the selected site.

