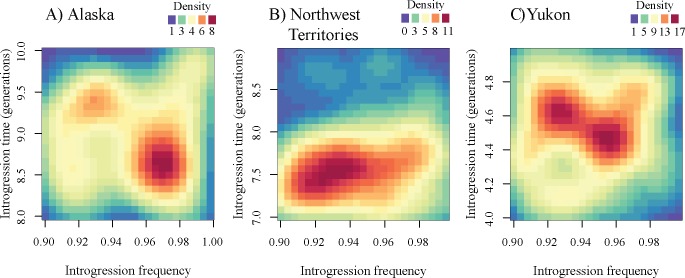
Fig. 9.
Posterior densities for introgression time (in generations) and introgression frequency in null simulations of (A) Alaska, (B) Northwest Territories, and (C) Yukon wolf populations. Red indicates higher probability, whereas blue indicates lower probability (see key for each plot). Our null model includes negative selection and a demography estimated from the data. Under this null model, there must be very recent introgression at a very high frequency, providing support for an alternate model with positive selection.

