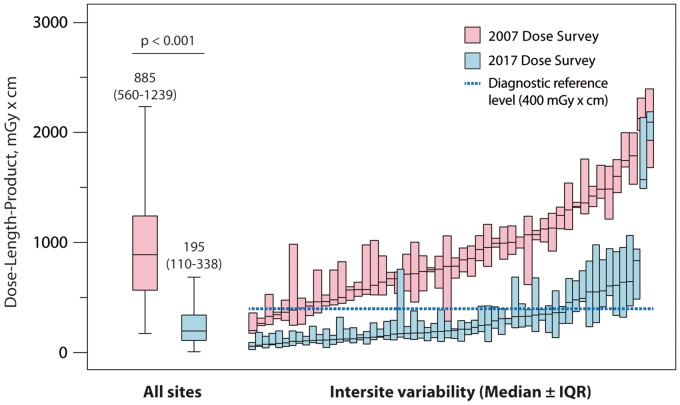
Take home figure.
Reduction of dose-length product from coronary computed tomography angiographies and variation between study sites. Left: box plots illustrate dose-length product of all coronary computed tomography angiographies. Right: variability of median dose-length product (± interquartile range) between the study sites in the 2007 and 2017 dose surveys, respectively.

