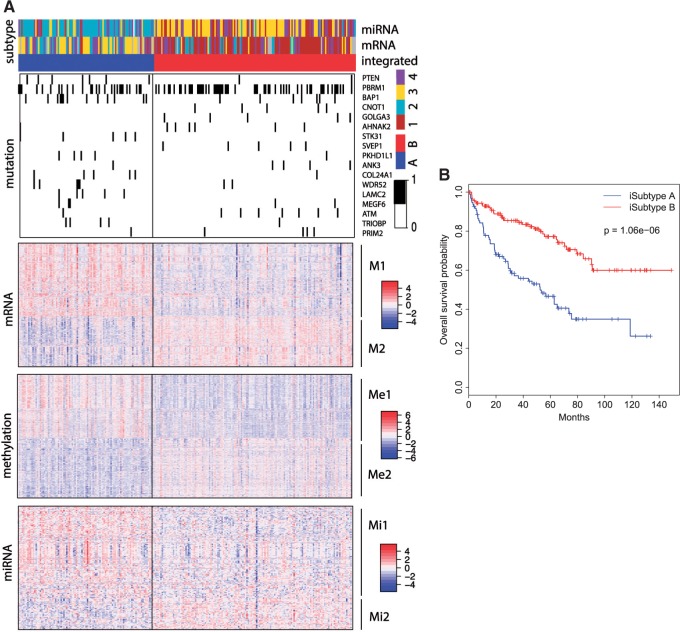
Fig. 4.
CCRCC integrative subtypes. (A): Heatmaps of the genomic features with posterior probability  . The TCGA miRNA and mRNA subtypes are shown on the top of the heatmaps. For the mutation heatmap, black and white represent mutation and no mutation, respectively. For the mRNA, miRNA and methylation heatmaps, blue, white, and red represent low, middle, and high level of expression or methylation, respectively. The feature clusters are labeled as M1 and M2 for mRNA, Me1, and Me2 for methylation, and Mi1 and Mi2 for miRNA, respectively. (B): K–M survival curves for iSubtypes A and B.

