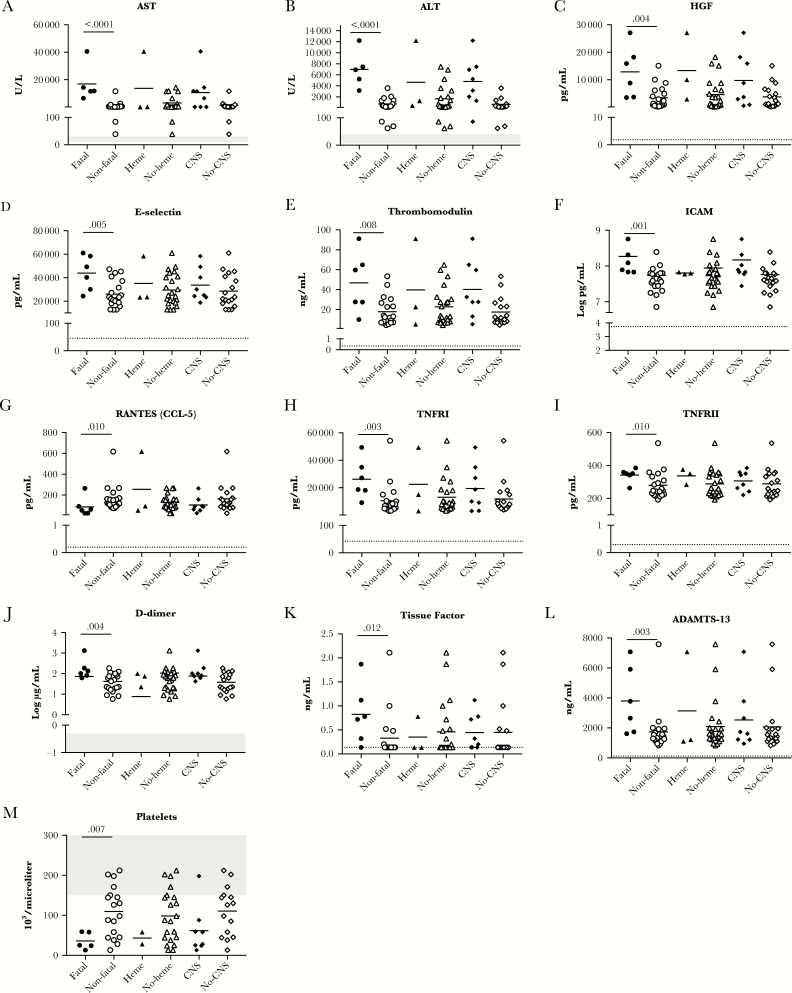
Figure 1.
A–M, Biomarkers with a significant association with fatal outcome. Biomarker levels are depicted as a function of outcome, hemorrhagic manifestations, or central nervous system manifestations. All individual data points are shown; the bar is the mean. Numbers above the data sets represent the P value as an indication of the statistical significance of the difference. Normal values are indicated on the graphs with gray shading in cases in which standard clinical ranges are established. The dotted line depicts the limit of detection of the assay. For tissue factor, many samples did not have any detectable tissue factor; these data are plotted at the limit of detection. Abbreviations: ADAMTS-13, a disintegrin and metalloproteinase with thrombospondin motifs 13; ALT, alanine aminotransferase; AST, aspartate aminotransferase; CNS, central nervous system; HGF, hepatocyte growth factor; ICAM, intercellular adhesion molecule; RANTES, regulated on activation normal T-cell expressed and secreted; TNFR, tumor necrosis factor receptor.

