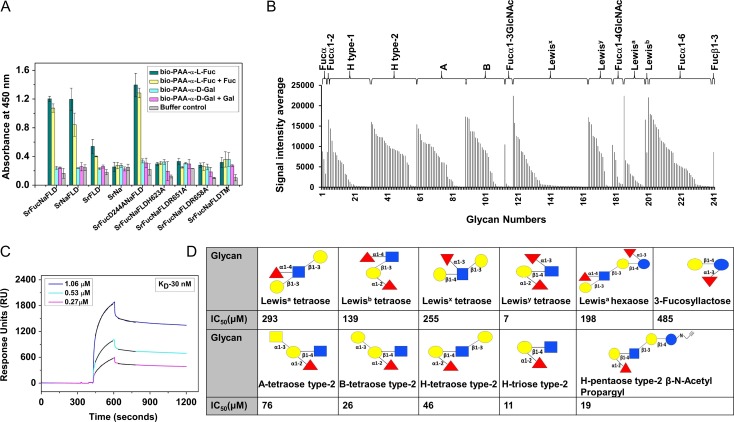
Fig. 2.
(A) ELLA of immobilized SrFucNaFLD, SrNaFLD, SrNa, SrFLD, SrFucD244ANaFLD, SrFucNaFLDH6232A, SrFucNaFLDR651A, SrFucNaFLDR658A and SrFucNaFLDTM proteins using biotinylated PAA-α-l-fucose and PAA-α-d-galactose probes. (B) Binding profile of SrFucD244ANaFLD to fucosylated glycans of different glycan categories on the CFG glycan array. (C) SPR sensorgrams representing binding of SrFucNaFLD to PAA-linked fucose coated on a CM5 sensor chip. Three different concentrations of SrFucNaFLD (1.06–0.27 μM) are shown here. The black lines over each sensorgram are the association and dissociation fit curves. (D) IC50 values of inhibition of binding of SrFucD244ANaFLD to PAA-fucose by different glycans, as obtained from SPR analysis. Monosaccharide symbols follow the SNFG (Symbol Nomenclature for Glycans) system (Varki et al. 2015).

