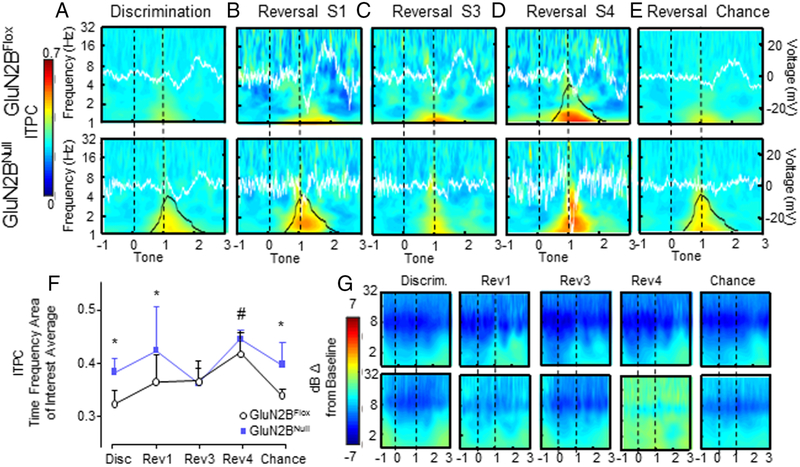
Figure 7: Loss of cortical GluN2B significantly increases dS ITPC.
A. Low levels of dS ITPC were seen across genotypes immediately following the reward cue during discrimination, with a significantly higher response in GluN2BNULL compared to controls. GluN2BNULL and controls displayed a decreased similar potential shift in ERP. GluN2BNULL and controls had a lasting increase in power response after the reward cue, until average reward retrieval. B. Upper and lower frequency ITPC remained elevated in GluN2BNULL versus control during reversal session 1. Peak ERP potential shift at time of reward cue was significantly decreased compared to discrimination but was not significantly different between genotypes. C. During the third reversal session, GluN2BNULL had equivalent ITPC responses to controls. ERP magnitude was not significantly different between genotypes. D. GluN2BNULL had equivalent ITPC response during reversal session 4. ERP potential change at reward cue increased in magnitude, but was not significantly different between genotypes. E. GluN2BNULL and GluN2BFLOX mice had significantly increased ITPC once chance criterion had been re-attained. ERP did not significantly differ between genotypes. F. TF-ROI averaged ITPC magnitude average during each session. # Significantly different from all sessions p<0.05, * Significantly different between genotypes p<0.05. G. dB change from baseline power was not significantly different across sessions or between genotypes. N=8 mice per genotype/recording session. Event related potential voltage is indicated by white line. Overall ITPC is shown via heat map. Black outline denotes significant difference between genotypes in the TF-ROI (bottom row) or significant difference from all other sessions (top row)

