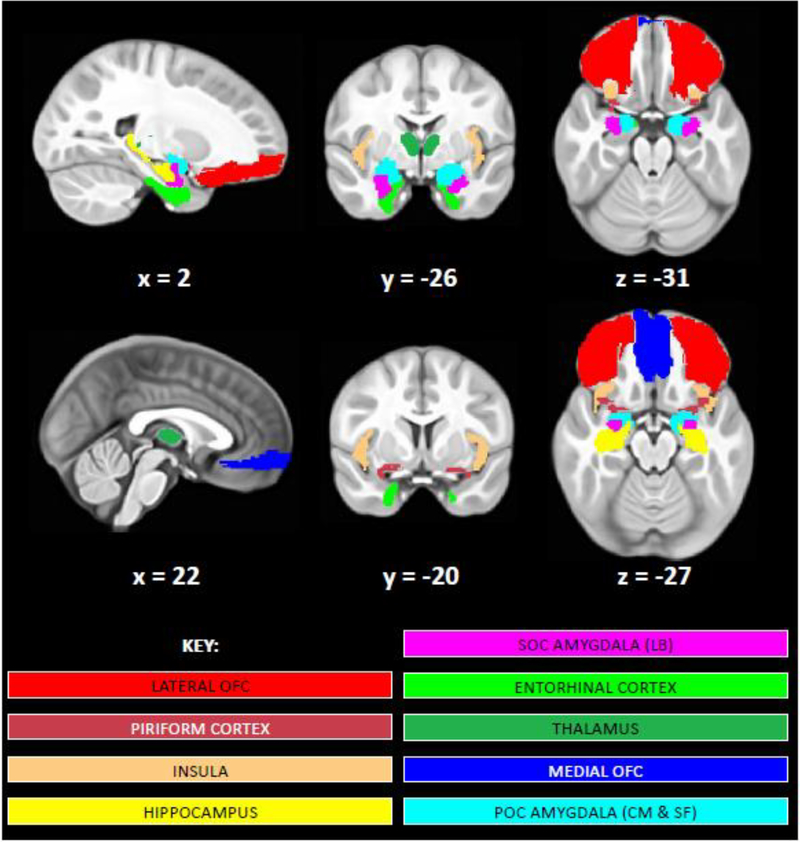
Figure 3.
Masks of primary olfactory cortex (POC) and secondary olfactory cortex (SOC) regions analyzed. Brain images display medial orbital frontal cortex (OFC; dark blue), lateral OFC (red), insular cortex (peach), piriform cortex (burgundy), POC amygdala (centromedial (CM) and superficial (SF) subregions; light blue), SOC amygdala (laterobasal (LB) subregion; magenta), hippocampus (yellow), entorhinal cortex (lime green), and thalamus (dark green) masks shown on our study-specific pediatric template. Images are shown in radiological convention (R=L). Left and right hemisphere masks for each of these regions of interest were analyzed separately except for the medial OFC.

