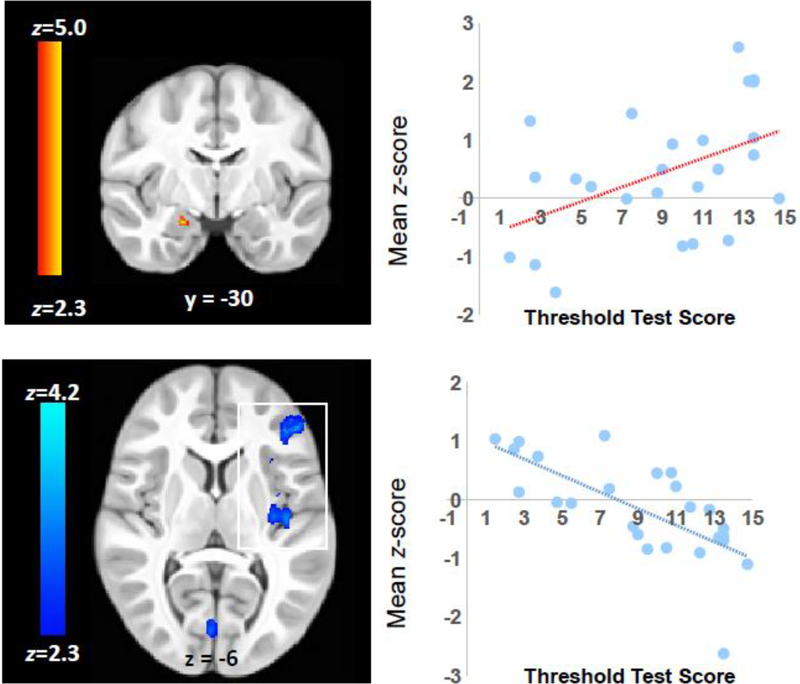
Figure 5.
The relationship between odor detection threshold and activation in the right superficial subregion of the amygdala (top) and frontal and insular regions (bottom). The scatter plots shows the mean activation for individual subjects within the significant cluster in the right amygdala and left frontal and insular cortex (boxed in white) plotted against the score of the Threshold Test from the Sniffin Sticks battery. Lower Sniffin’ Sticks Threshold Test scores indicate a higher olfactory detection threshold and therefore poorer ability to detect odorants at low concentrations. Images are shown in radiological convention (R=L).

