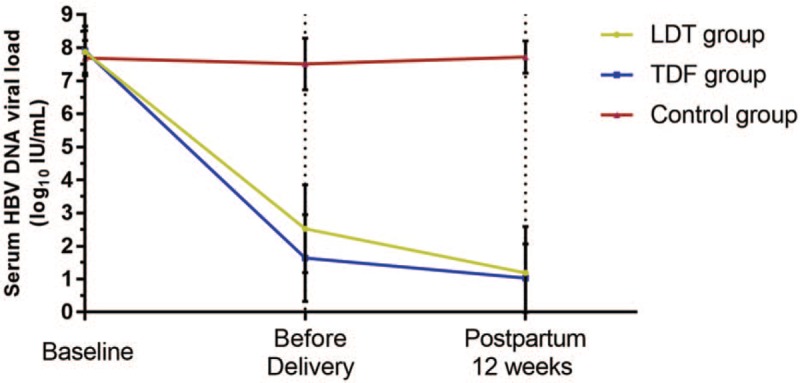
Figure 1.

The dynamic changes of serum HBV DNA level in groups. Serum HBV DNA levels of the 3 groups were similar at baseline (Group A vs. Group B vs. Group C, 7.88 ± 0.65 vs. 7.91 ± 0.75 vs. 7.69 ± 0.53 log10 copies/mL, P = .25). The HBV DNA viral load in Groups A and B were significantly decreased after treatment (2.52 ± 1.33 and 1.64 ± 1.31 log10 copies/mL in Group A and B). The serum HBV DNA levels in both Groups A and B were lower than that of Group C (P < .01, both), while no significant differences observed in HBV DNA levels between Groups A and B before delivery and at 12 weeks postpartum. HBV = hepatitis B virus.
