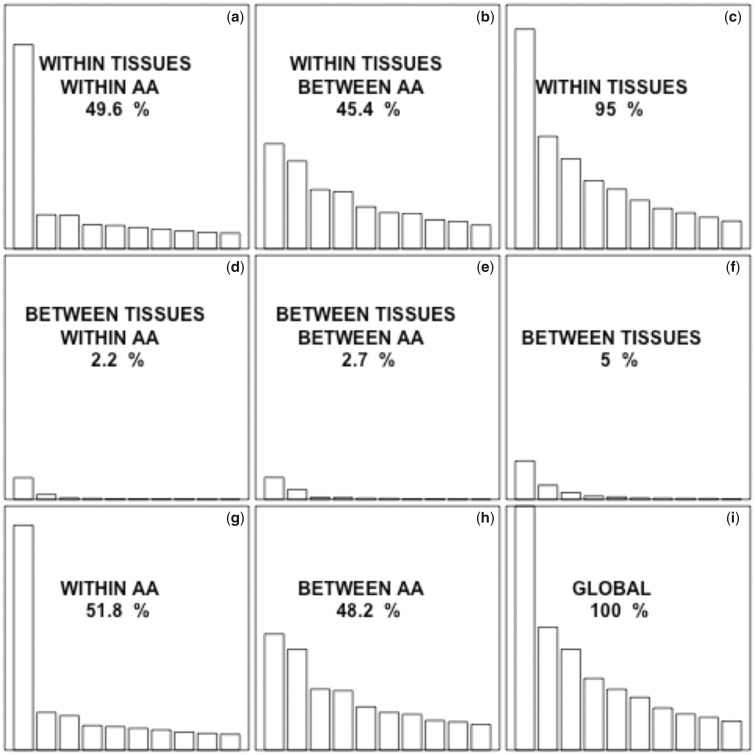
Fig. 2.
—Contribution to the global codon usage variability of synonymous, nonsynonymous, between-tissues, and within-tissues effects. The eigenvalue for a given factor is proportional to the fraction of the variability in codon usage that is accounted for by that factor. The total contribution to the variance of each component is indicated. All the graphs are on the same scale to allow direct visual comparison. In each graph, only the first 10 eigenvalues are represented. The fraction of the global variability due to synonymous codon usage (a, d, g) is higher than the fraction explained by nonsynonymous codon usage (b, e, h). The fraction explained by the differences in codon usage within tissues (a, b, c) is much higher than the fraction explained by the differences between tissues (d, e, f).

