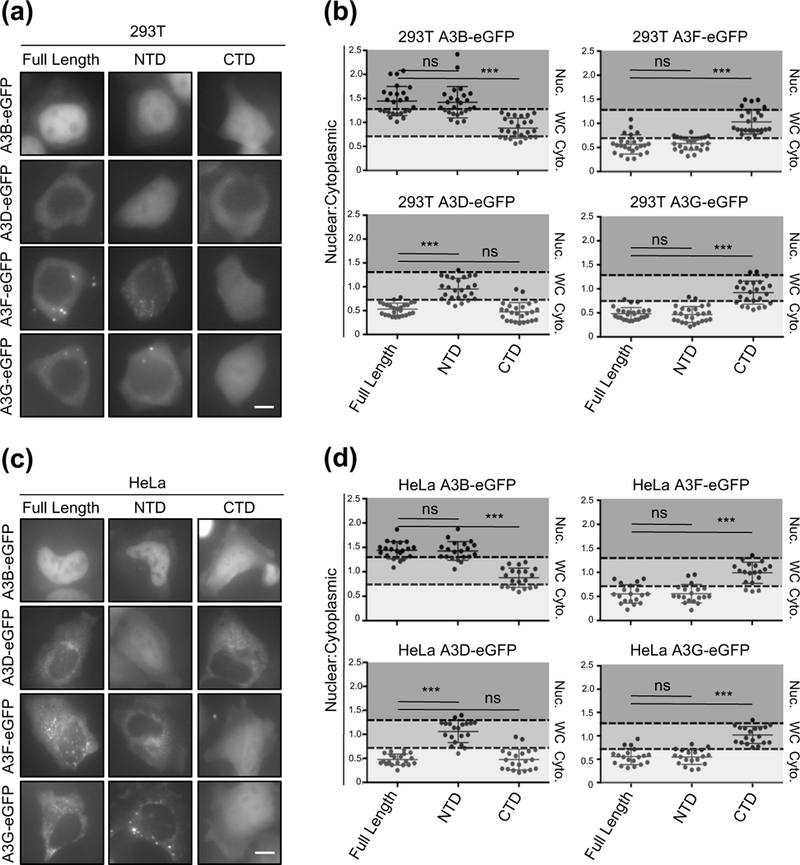
Figure 3. Localization of A3B, A3D, A3F, and A3G full-length and single domain variants.

(a and c) Representative images of 293T and HeLa cells transiently expressing indicated C-terminally eGFP-tagged A3 full-length, NTD, or CTD constructs (10 𝜇m scale bar). (b and d) Quantification of localization patterns for the indicated amino acid substitution mutants (n=25 for 293T cells and n=20 for HeLa cells; image quantification and statistical analysis as described in Fig. 1).
