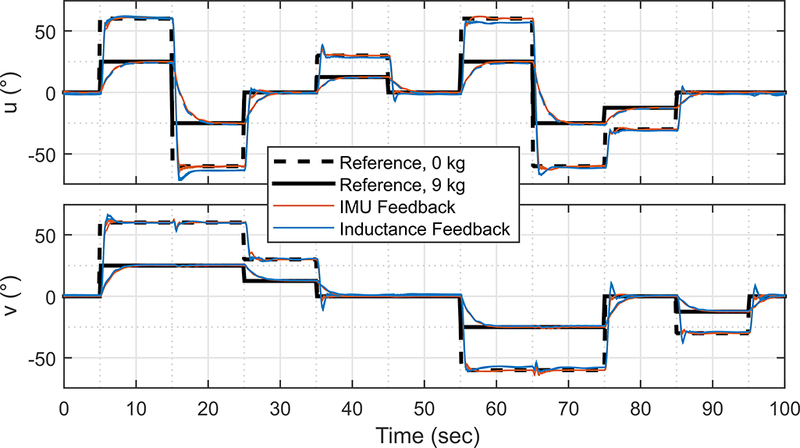
Fig. 13.

The data from the feedback control experiments. The dashed black line is the reference trajectory for the tests in the 0 kg weight condition. The solid black line corresponds to the 9 kg tests. The blue lines are the three inductance-feedback tests conducted in each weight condition. The tracking performance of the inductance feedback is comparable to that from the IMU (red lines).
