Figure 1.
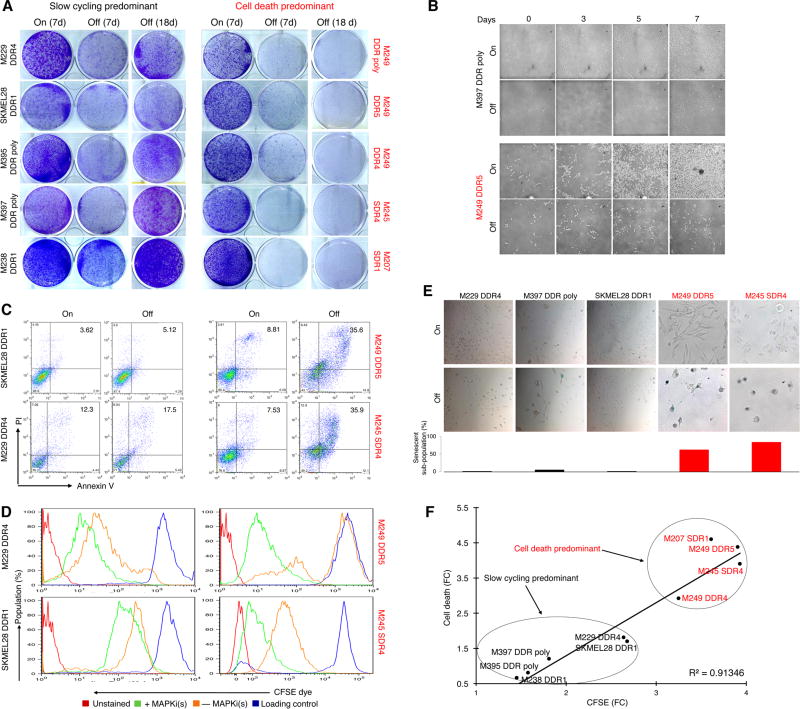
MAPKi-resistant melanoma display distinct drug-addiction phenotypes characterized by slow-cycling versus cell-death responses. (A) Clonogenic growth of double-drug resistant or DDR (MUTBRAF) or single-drug resistant or SDR (MUTNRAS) melanoma cell lines plated 24 hrs with BRAFi (vemurafenib)+MEKi (selumetinib) at 1 µM or MEKi (trametinib) at 0.1 µM followed by 7 d with (On) or 7 and 18 d without (Off) inhibitor withdrawal. (B) Temporal vital images of MAPKi-resistant or R-lines on or off BRAFi+MEKi. (C–E) Percentages of annexin V/PI-positive dead cells (C), CFSE dye dilution patterns (D), and levels of SA-βgal staining (E) in R-lines on or off MAPKi(s) for 6 d. Loading control (D) refers to the intensity of the CFSE dye initially loaded into the cells. (F) Correlation between fold-changes (FC) in CFSE dye dilution and % cell death off vs. on MAPKi(s).

