Figure 5.
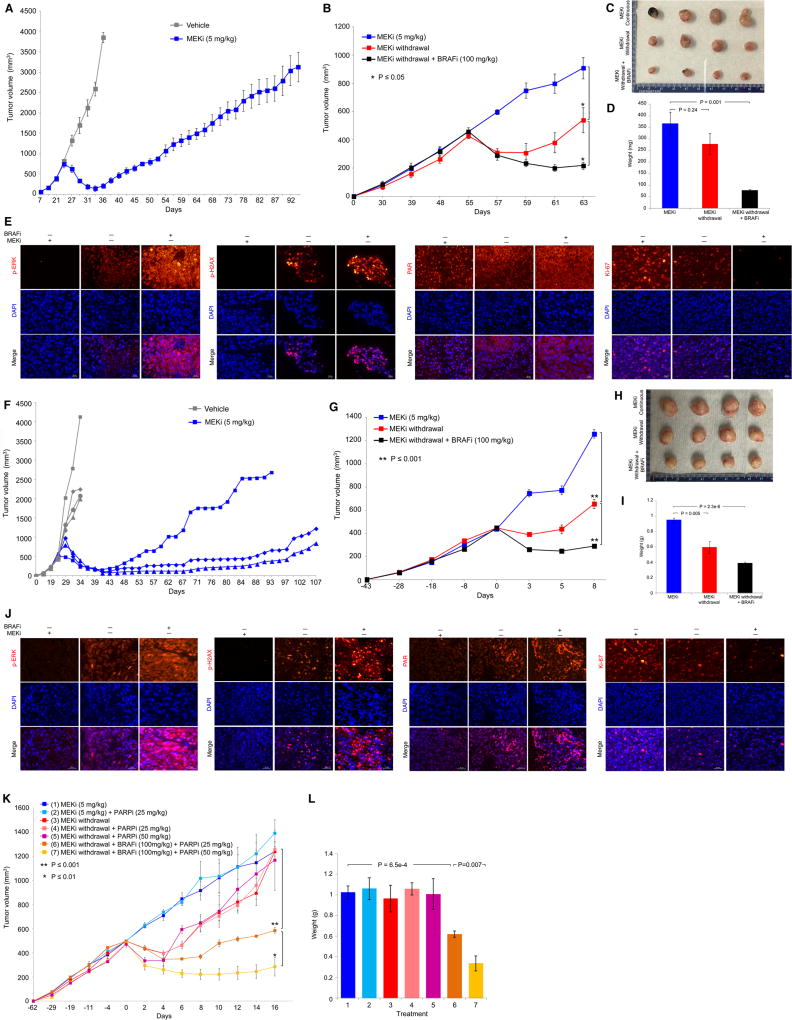
Excessive ERK and DNA damage induce regression of MEKi-resistant PDX tumors. (A) Tumor volumes (mean ± SEM) of a MUTNRAS PDX transplanted in NSG mice in response to daily gavage with the vehicle (n = 3) or trametinib (5 mg/kg; n = 5). Asterisk indicates the resistant tumor, R1, which was serially transplanted for experiment in B. (B) R1 trametinib-resistant MUTNRAS PDX tumors were grown in NSG mice for 55 days with daily trametinib (5 mg/kg) gavage until initiating indicated daily treatments or regimens (n = 4 in each group). Tumor volumes are shown as means ± SEM. P values, Student’s t-test. MEKi, trametinib (5 mg/kg); BRAFi, vemurafenib (100 mg/kg). (C) Pictures of tumors from three experimental groups in B at day 63. (D) Tumor weights (means ± SEM; p value, unpaired t-test) of three experimental groups in B. (E) Levels of indicated proteins in representative tissue sections of tumors in C. Ruler, 20 µm. (F–J) As in A to E except experiments used a distinct PDX model harboring S365LBRAF and individual tumor growth curves were plotted separately in F. The MEKi-resistant tumor (R3) which arose first was fragmented, serially passaged and used in G. (K–L) R1 trametinib-resistant MUTNRAS PDX tumors were serially passaged in NSG mice with daily trametinib (5 mg/kg) gavage until segregation into seven groups (1, 2, 3, 5, n=3 per group; 4, 6, 7, n=5 per group). Tumor volumes and weights are shown as means ± SEM. P values, Student’s t-test.

