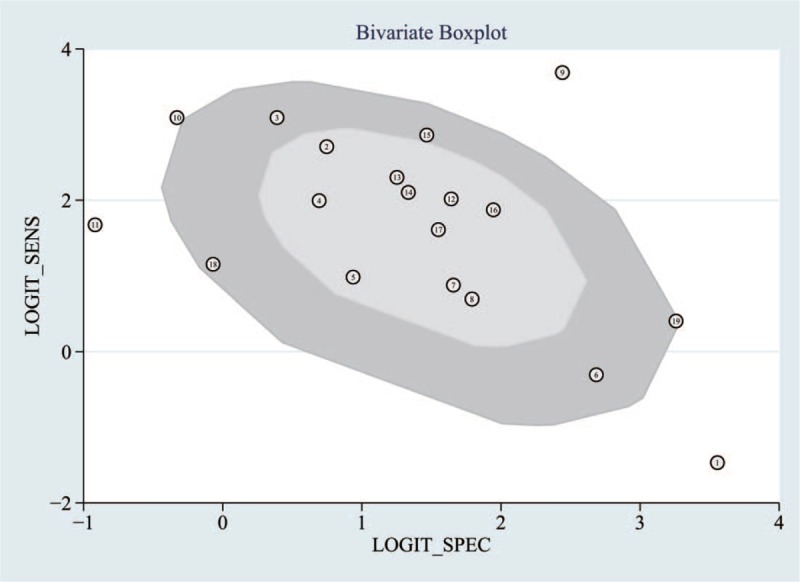
Figure 5.

The bivariate boxplot about the heterogeneity was drawn. It demonstrated that 6 sets of data were out of the circles, which indicated there was heterogeneity between articles we included.

The bivariate boxplot about the heterogeneity was drawn. It demonstrated that 6 sets of data were out of the circles, which indicated there was heterogeneity between articles we included.