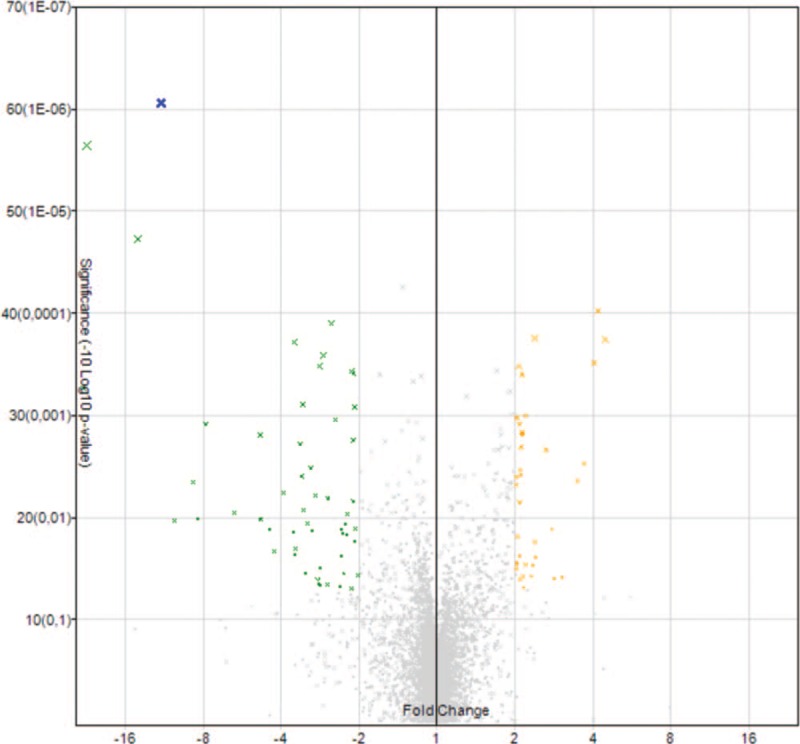
Figure 1.

Volcano Plot. Deregulated miRNA in microarray analysis. The amount of microRNAs with statistically significant differences of expression can be appreciated in this graph. Those with a significantly higher expression are yellow highlighted and with a significantly lower expression green highlighted. Fold change is specified on the x-axis.
