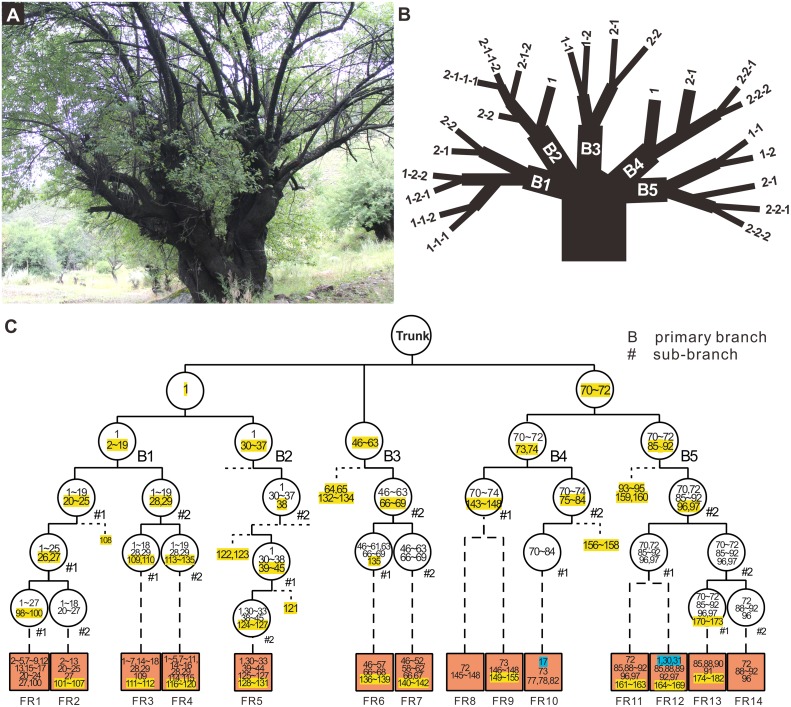
Fig 2. Distribution of somatic mutations and the mutations of meiotic progeny in an old peach tree.
(A) Photo of the GL2 tree at Nyingchi in Tibet. (B) Sampled leaves in the terminal branches of the tree. (C) The history of the mutations. All mutations including somatic mutations from the tree and the mutations identified in 14 meiotic progeny are numbered. The yellow highlighted numbers represent the first occurrence of a de novo mutation in the tree’s history. The numbers without highlight represent the derived mutations from the previous level of a branch. Each circle represents the branching node where new mutations arise, and the brown box represents the progeny sampled from this branch. Branches with no fruit sampled are not shown (dashed lines beside circles) for better visualization. The unhighlighted and highlighted numbers in the brown box stand for the inherited somatic mutations from GL2 and the de novo mutations, identified specifically from the meiotic offspring, respectively. The blue highlighted mutations in the FR9 brown box are supposed to be inherited from the branch of B4 via outcrossing.

