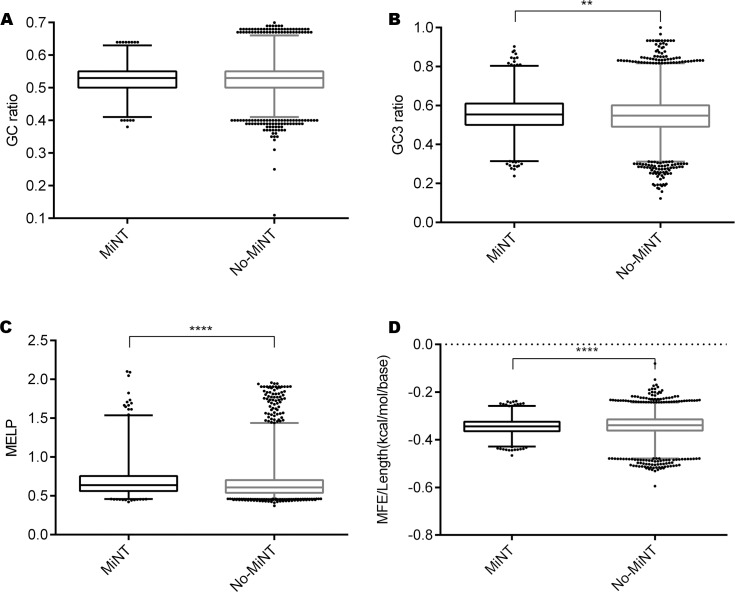
Fig 2. Analysis of MiNT vs No-MiNT CDS parameters.
Box-plot with whiskers (percentile 1–99%) of (A) G+C Content ratio (p-value 0.4321), (B) G+C in the third codon position ratio (p-value < 0.002), (C) MELP, Measure Independent of Length and Composition -based Expression Level Predictor, (p-value < 0.001) and (D) MFE (minimum free energy)/Length ratio (p-value < 0.001).

