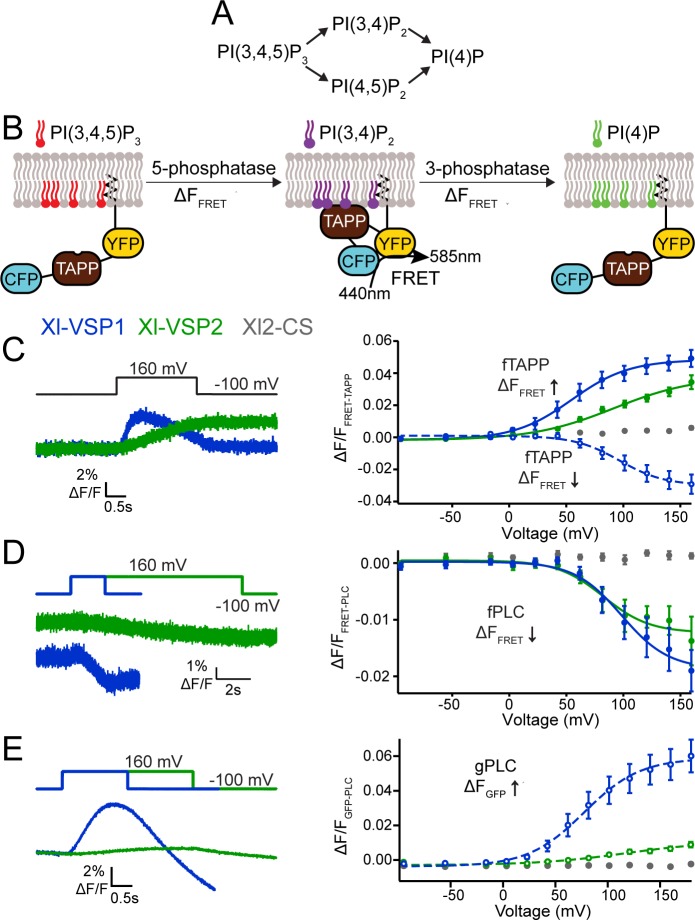
Fig 6. Xl-VSP1 and Xl-VSP2 function as voltage-regulated 5- and 3-phosphatases.
(A) Schematics of the known VSP reactions. (B) Cartoon representation of fTAPP binding and release with increasing and decreasing PI(3,4)P2 concentrations. The binding of fTAPP to PI(3,4)P2 results in a conformational change that increases the FRET signal. Similarly, a reduction of PI(3,4)P2 results in a decrease in the FRET signal. Similar binding and release occurs with the fPLC sensor when PI(4,5)P2 concentrations are changed. (C) Oocytes were injected with fTAPP and either Xl-VSP1, Xl-VSP2 or Xl-VSP2 C301S (Xl2-CS), a catalytically inactivated protein. (left) Averaged fTAPP FRET traces over time during a voltage step from a holding potential of -100 to +160 mV. The FRET signal increases and decreases in the same pulse for Xl-VSP1 while it only increases for Xl-VSP2. (right) FRET measurements were tested at several voltages and the ΔF/F fTAPP FRET ratio was plotted versus the voltage (RV). The FRET increase (net 5-phosphatase reaction, solid line, closed symbols) was plotted by subtracting the baseline from the peak ΔF/F FRET ratio. The FRET decrease (net 3-phosphatase reaction, dashed line, open symbols) was plotted by subtracting the peak ΔF/F FRET ratio from the ΔF/F FRET ratio at the end of the voltage step. Xl-VSP1 shows robust activity as both a 3- and 5- phosphatase while Xl-VSP2 functions as a 5-phosphatase. (D) Oocytes were injected with fPLC and either Xl-VSP1, Xl-VSP2 or Xl2-CS. (left) Averaged fPLC FRET traces over time during a voltage step from a holding potential of -100 to +160 mV for fPLC co-expressed with either Xl-VSP1 or Xl-VSP2. The kinetics of activation are significantly faster for Xl-VSP1 than for Xl-VSP2. (right) The ΔF/F fPLC FRET RV shows a FRET decrease (net 5-phosphatase reaction, solid line, closed symbols) for both Xl-VSP1 and 2 indicating both dephosphorylate PI(4,5)P2. (E) Oocytes were injected with gPLC and either Xl-VSP1, Xl-VSP2 or Xl2-CS. (left) Averaged gPLC fluorescence traces over time during a voltage step from a holding potential of -100 to +160 mV for gPLC co-expressed with either Xl-VSP1 or Xl-VSP2. The kinetics of activation are significantly faster for Xl-VSP1 than for Xl-VSP2. (right) GFP fluorescence measurements were tested at several voltages and the fluorescence voltage relationship plotted showing a fluorescence increase (net 3-phosphatase reaction, dashed line, open symbols). While Xl-VSP1 shows significant levels of 3-phosphatase activity against PI(3,4,5)P3, Xl-VSP2 is a much less efficient 3-phosphatase. All error bars are ± SEM., n ≥ 9. Data fit with single Boltzmann equations. For each experiment, the oocyte was incubated in 8 μM insulin to increase PI(3,4,5)P3 concentrations.

