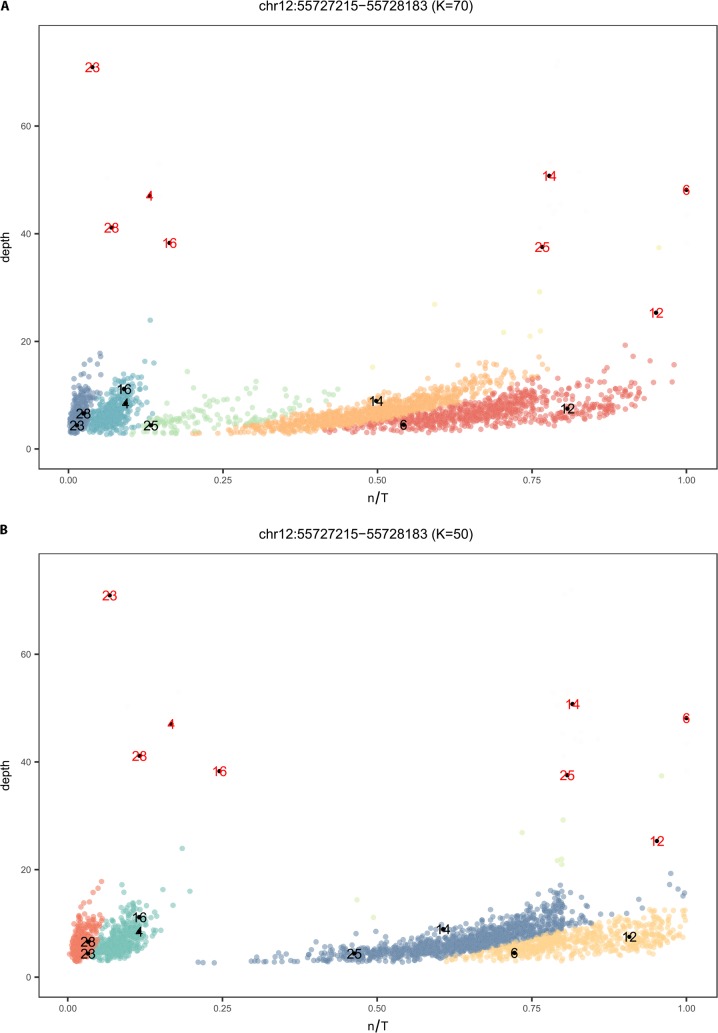
Fig 1. A mixture model to account for low depth WGS data.
A) Mixture model output on n/T values of 2535 individuals from KGP with low depth sequence data for chr12:55727215–55728183 when K = 70. At this value of k there are clusters representing low n/T values that are not well resolved and individual 25 and 14, which have the same status in high depth data, are assigned to different clusters. B) The result of the mixture model on the same data with k optimized to 50. The model returns four clusters each indicated by a unique color and eight of the 28 individuals that have both low and high depth sequence data are shown (see S1 Dataset:KGP for identification). The n/T ratio is 1 for persons with high depth data [red numbers, #6 and 12] who have the reference allele, while the corresponding low depth data [black numbers, yellow cluster] from the same individuals have n/T ranging from 0.7 to 0.9. There is less of an effect of sequence depth for individuals who do not have the HERV-K (n/T = 0, red cluster, #23 and 28). However optimizing k improves separation of the solo LTR (green cluster; #4 and #16) from the blue cluster (#25 and #14), which represents a state where some unique k-mers in the set T are missing in the query data (this is likely an allele; see S3 Fig). States are confirmed by mapping the k-mers from individuals in a cluster to the reference HERV-K at this locus (S3 Fig).

