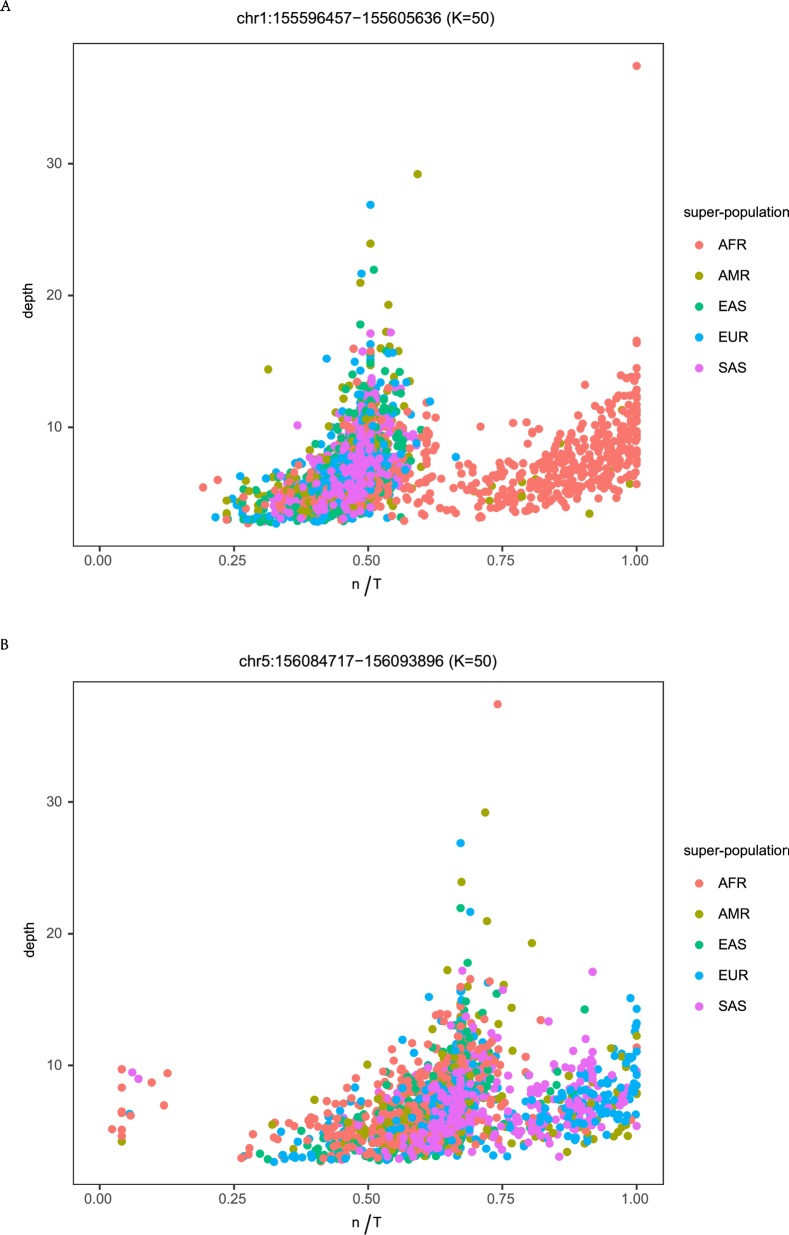
Fig 5. Population specificity of HERV-K alleles.
A) n/T plot for HERV-K at chr1:155596457–155605636 colored by each of the 5 super-populations. Only individuals from AFR and a few from AMR have an n/T approximating 1 indicative of the HERV-K reference sequence. B) Plot of chr5:156084717–156093896 colored by each of the 5 super-populations. In this case, all populations except AFR have the reference allele and all super-populations have an alternative allele that is not present in our reference set.

