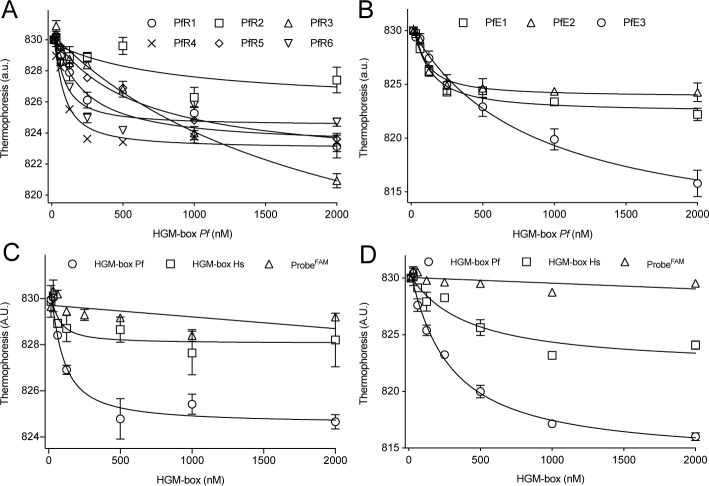
Fig 3. Aptamers efficiently bind the HMG-box from P. falciparum.
MST analysis of the interaction between aptamers and HMG-box. (A) Thermophoresis changes of best ranked aptamers as a function of HMG-box Pf concentration. (B) Thermophoresis changes of the most enriched aptamers as a function of HMG-box Pf concentration. Specificity assessment for PfR6 (C) and PfE3 (D). The binding of each aptamer to HMG-box Pf (open circles) was compared to the human homolog (open squares) or in the absence of the aptamer (open triangles). All reactions were measured in triplicates. Error bars indicate standard deviations. Continuous lines show the non-linear regression using a quadratic equation, allowing to estimate a Kd values (Table 1).

