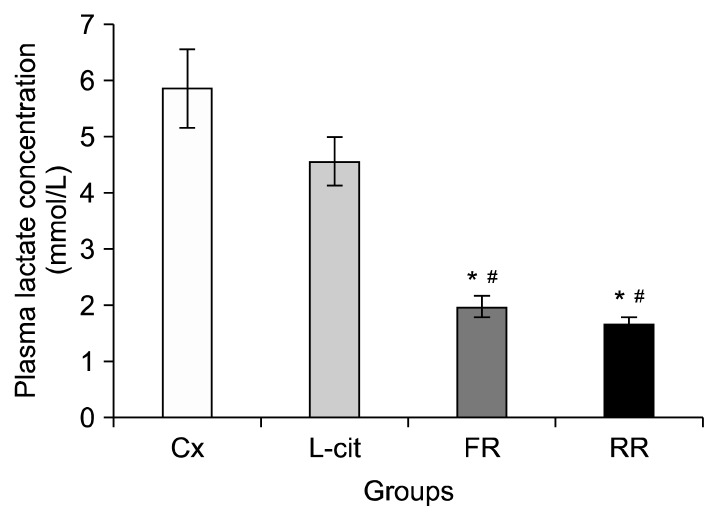
Fig. 3.
Plasma lactate concentration in groups of rats supplemented with 100% flesh watermelon juice, 100% rind watermelon juice, L-citrulline, and control. The bar chart shows plasma lactate concentration (mmol/L) in Cx, L-cit, FR, and RR. Values were expressed as mean±SEM (n=6). Significant difference compared to *Cx and #L-cit (P <0.05). Cx, negative control group; L-cit, positive control group; FR, group of rats supplemented with 100% flesh watermelon juice; RR, group of rats supplemented with 100% rind watermelon juice.

