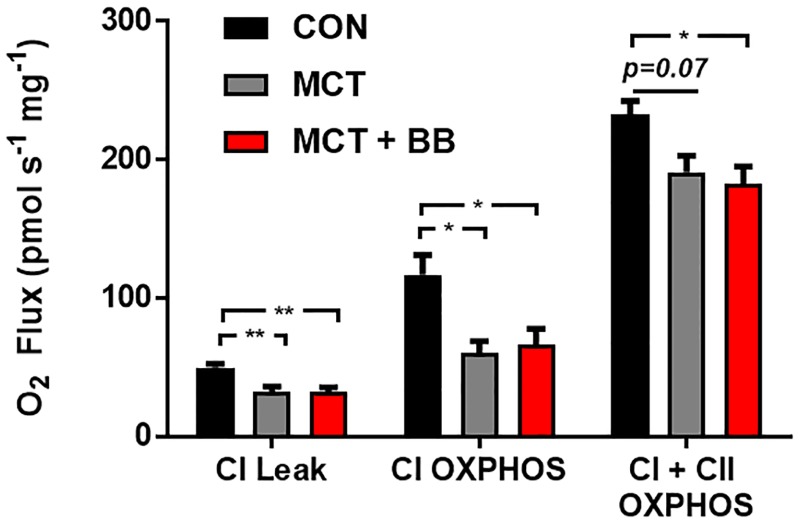
Fig 3. Respiration of permeabilised fibres stimulated with saturating ADP.
Mean ± SEM O2 flux normalised to wet weight (pmol s-1 mg-1) are shown in black for the controls (CON; n = 6), in grey for monocrotaline (MCT; n = 5) and in red for metoprolol treated monocrotaline rats (MCT + BB; n = 6). Steady-state measurements were taken in the presence of complex I substrates (CI Leak for NADH-stimulated Leak), after the addition of ADP (CI OXPHOS) and finally complex II substrate succinate (CI + CII OXPHOS). Statistical significance are denoted by * p < 0.05, ** p < 0.01, using one-way ANOVA with Sidak’s multiple comparisons.

