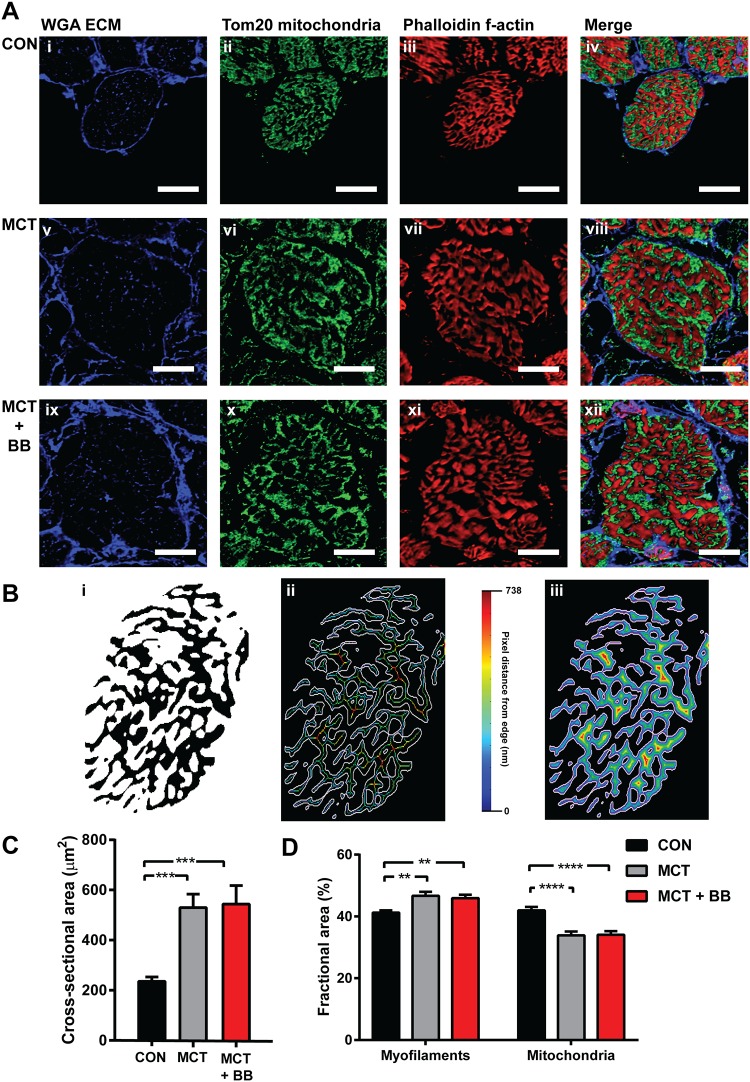
Fig 5. Confocal images of RV cardiomyocytes and analysis.
A: Representative transverse sections (20 μm) labelled with extracellular matrix marker (ECM) wheat germ agglutinin (WGA) in blue (first column), mitochondrial marker anti-Tom20 in green (second row) and f-actin marker phalloidin in red (third row). The final column shows a merged image of all three channels. Scale bars are 10 μm. Images show RV cardiomyocytes from a control heart (CON; i—iv), a monocrotaline heart (MCT; v—viii) and a monocrotaline treated with metoprolol heart (MCT + BB; ix—xii). B: Mask created from image A iii was used to calculate fractional area of f-actin, and determine the mean distance from the skeleton (B ii) or from each pixel to the outer edge of the f-actin bundles (B iii). Visual representation is shown in images B ii—iii where all pixels (or skeleton pixels) are coloured according to the distance to their closest edge (white). C: Cross-sectional area of RV cardiomyocytes determined from tracing the WGA labelling shown in A. D: Fractional areas calculated from masks created from f-actin (myofilament) and Tom20 (mitochondria) confocal images. Control (CON; N = 3 hearts, n = 22 cells), monocrotaline (MCT; N = 3 hearts, n = 19 cells) and monocrotaline treated with metoprolol (MCT + BB; N = 3 hearts, n = 19 cells). Significant differences are denoted by ** p < 0.01, *** p < 0.001, **** p < 0.0001, using one-way ANOVA.

