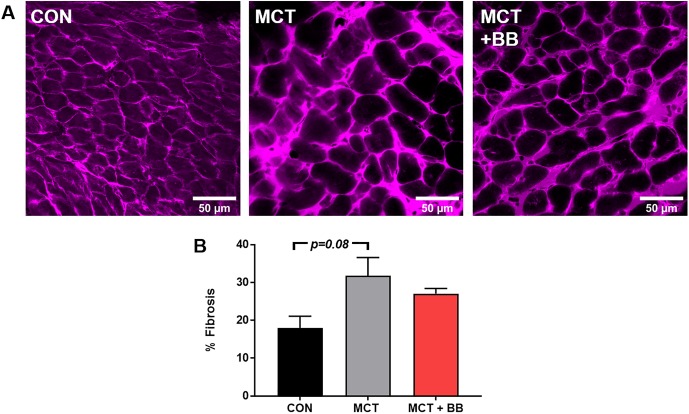
Fig 6. Right ventricle fibrosis.
A: Representative overview images (248 x 248 μM) of RV tissue labelled with extracellular matrix marker, wheat germ agglutinin. Five images were taken from each heart (n = 3 hearts). B: Mean ± SEM from control (CON), monocrotaline (MCT) and monocrotaline treated with metoprolol (MCT + BB). A trend towards significance was found using one-way ANOVA.

