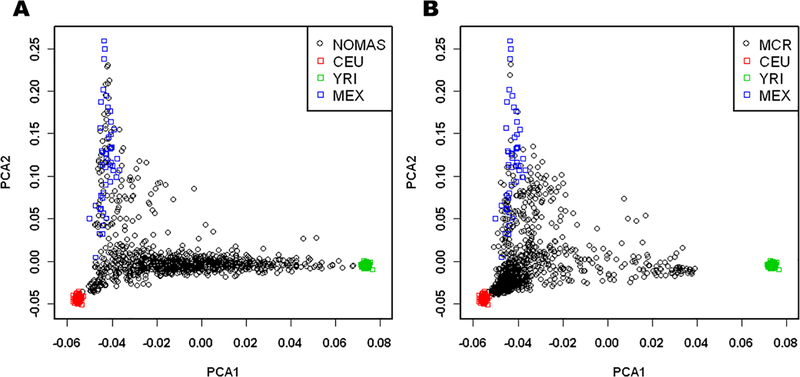
Figure 1: Plots of Principal Components 1 and 2, for NOMAS, MCR, and HapMap data.
Principal Components (PC) 1 and 2 of the (A) NOMAS dataset and (B) MCR dataset projected onto a HapMap population-based PC space. The X axis indicates PC1, differentiating African ancestry from non-African ancestry. The Y axis indicates PC2, differentiating Asian/Native American ancestry from non-Asian/non-Native American ancestry.

