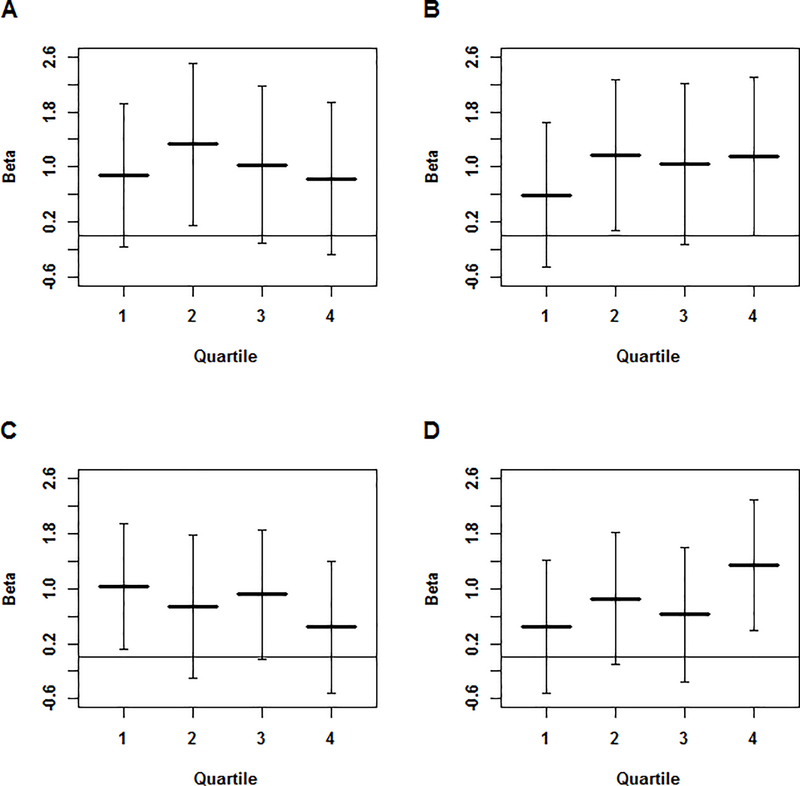
Figure 2. β Coefficients by PC-based Quartiles.
β coefficients and 95% confidence intervals for the analysis of (A) SBP by quartiles of PC1, (B) SBP by quartiles of PC2, (C) DBP by quartiles of PC1, and (D) DBP by quartiles of PC2. For plots A and C, lower quartiles indicate less African ancestry. For plots B and D, lower quartiles indicate less Asian/Native American ancestry.

