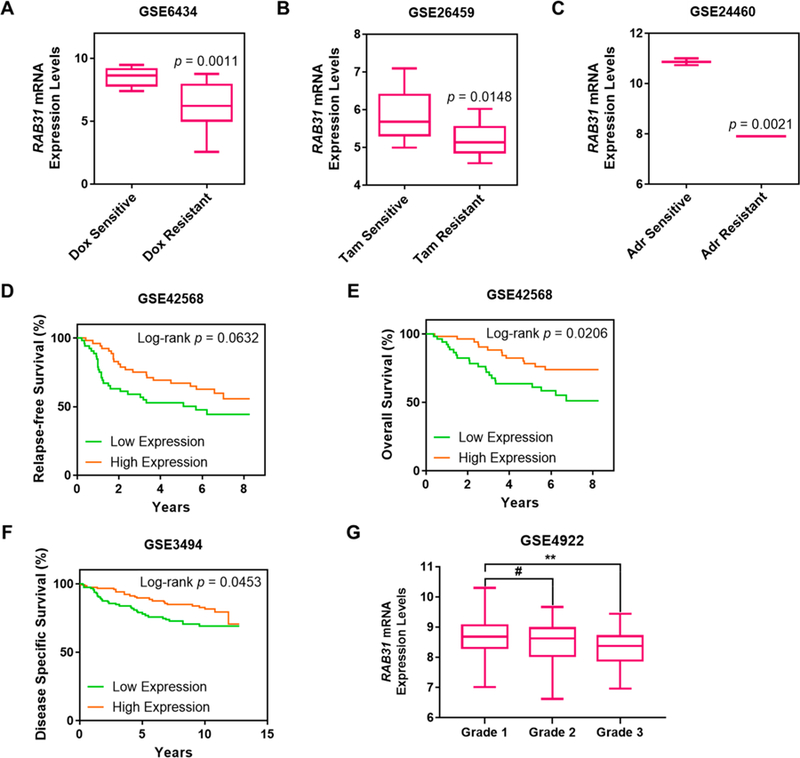
Figure 4.

Bioinformatic analysis revealing RAB31 as a potential predictive marker for tamoxifen resistance. (A–C) Differential-expression analysis for RAB31 in (A) docetaxel-, (B) tamoxifen-, and (C) doxorubicin-resistant MCF-7 cell lines in three data sets, GSE6434, GSE26495, and GSE24460, respectively (Dox: docetaxel, Tam: tamoxifen, Adr: adriamycin or doxorubicin). (D–G) Kaplan–Meier survival analyses for (D) relapse-free survival (RFS) in the GSE42568 data set, (E) overall survival (OS) in the GSE42568 data set, (F) disease-specific survival (DSS) in the GSE3494 data set, (G) differential RAB31 expression in different grades of breast-cancer progression in the GSE4922 data set. The patient population was stratified by median RAB31-mRNA-expression levels. The p values for the Kaplan–Meier curves were calculated by using the logrank test. The p values for the box-whisker plots were calculated by using an unpaired, two-tailed Student’s t test (#p > 0.05, *p < 0.05, **p < 0.01).
