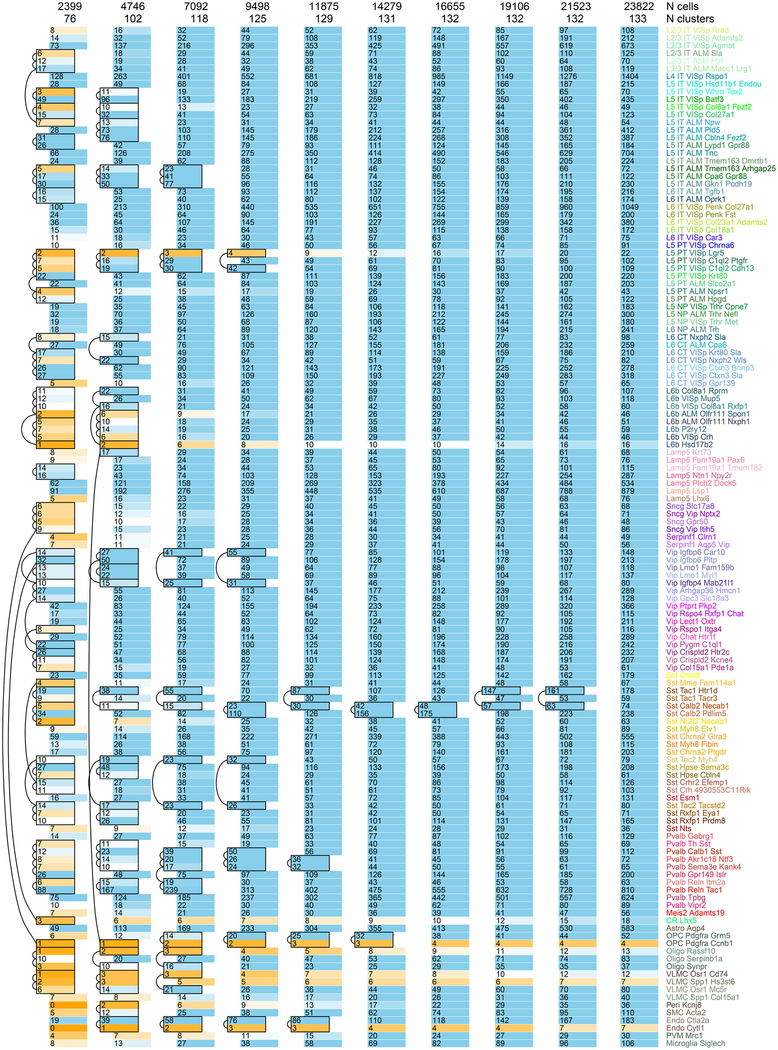
Extended Data Fig. 7 |. Saturation of cell type detection.
We tested the ability of our of computational approach to segregate cell types based on our standard cluster separation criteria (Methods) upon decreasing cell numbers included in clustering. The total number of sampled cells and derived clusters in each trial is shown at the top of each column. Each row is a cluster from our full dataset analysis. Each coloured box represents the number of cells from each cluster (row) that were included in the specific downsampled dataset (column). Clusters that merge are shifted to the left of their respective columns and merging is indicated by arcs and/or removal of lines between adjacent clusters. For most types, we were able to segregate them from their related types with many fewer cells than present in the complete dataset. Further cell sampling may reveal additional diversity, especially for rare cell types.

