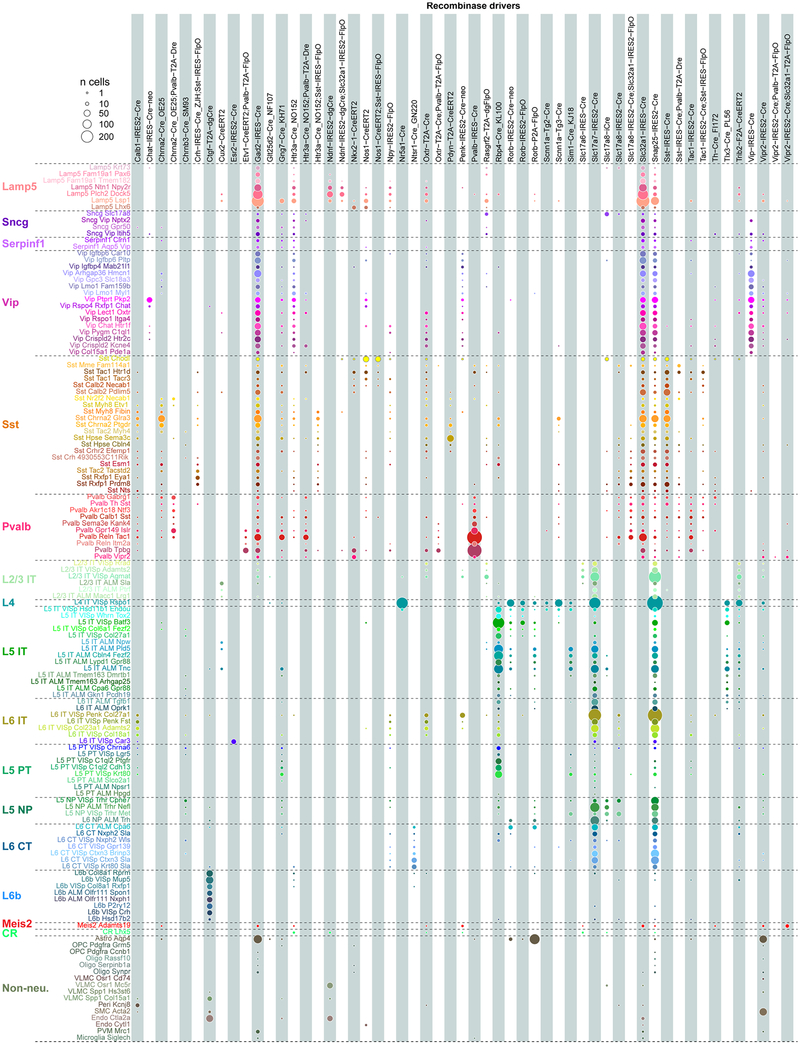
Extended Data Fig. 8 |. Cell-type labelling by recombinase driver lines.
Driver line names are listed on top (columns, n = 55) and cell types on the left (rows, n = 133). Coloured discs represent the numbers of cells detected for each type (cell numbers are proportional to disc surface area). This plot is based on 20,758 cells isolated from transgenic mice that were collected as tdT+ or GFP+ by FACS. Note that the relative proportions of cell types obtained in these experiments are likely to be affected by cell type-specific differences in survival during the isolation procedure and by samping via layer-enriching dissections.

