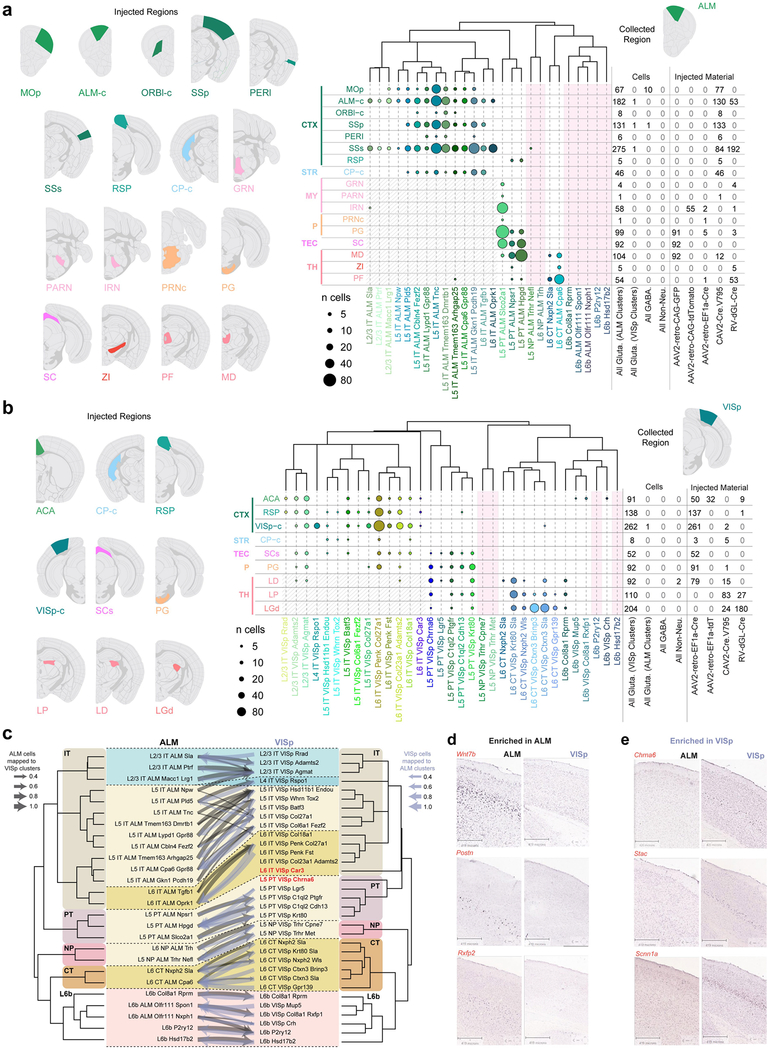
Extended Data Fig. 10 |. Retro-seq and comparison of cell types across regions.
a, b, Injection targets for retro-seq, represented by select Allen Reference Atlas images are displayed on the left. The plots on the right show injection targets in rows and cell types in columns for annotated retro-seq cells collected from the ALM (n = 1,152) (a) or VISp (n = 1,052) (b). Cell numbers are represented as discs, coloured according to detected cell types. Cell numbers from each target segregated by categories (based on broad type or virus injected) are shown to the right. We used three types of viral tracers expressing Cre: CAV2-Cre, rAAV2-retro-EF1a-Cre and RVΔGL-Cre, and injected them into a Cre-reporter line Ai14. For ALM experiments, we also injected rAAV2-retro-CAG-GFP or rAAV2-retro-CAG-tdT into wild-type mice. To ensure diverse coverage of projection neuron types, at least two virus types were used for most broad target regions (except for striatum and tectum for ALM, and tectum for VISp), as different viruses may display different tropisms. Cell types that were never isolated from the retrograde tracing experiments are shaded pink. Grey-hatched regions denote cells that may have been labelled unintentionally (but unavoidably) through the needle injection tract. For most subcortical injections into VISp-projection areas, the needle goes through the cortex, and some IT cells are labelled through the virus deposited along the needle tract. One exception is the injection into the superior colliculus for VISp experiments, in which we avoided cortical labelling by injecting at an angle through the cerebellum (Methods). Each injection target is labelled according to the centre of the corresponding injection site, however, neighbouring regions are often infected (Supplementary Table 5). Reference atlas abbreviations are as follows: ACA, anterior cingulate area; ALM-c, contralateral anterior lateral motor area; CP-c, contralateral caudoputamen; CTX, cortex; GRN, gigantocellular reticular nucleus; IRN, intermediate reticular nucleus; LD, lateral dorsal nucleus of the thalamus; LGd, dorsal lateral geniculate complex; LP, lateral posterior nucleus of the thalamus; MD, mediodorsal nucleus of the thalamus; MOp, primary motor area; MY, medulla; ORBl-c, contralateral orbital area, lateral part; P, pons; PARN, parvicellular reticular nucleus; PERI, perirhinal area; PF, parafascicular nucleus; PG, pontine grey; PRNc, pontine reticular nucleus dorsal part; RSP, retrospenial area; SC, superior colliculus; SCs, superior colliculus sensory related area; SSp, primary somatosensory area; SSs, supplementary somatosensory area; STR, striatum; TEC, tectum; TH, thalamus; VISp-c, contralateral primary visual area; ZI, zona incerta. c, Mapping of glutamatergic cells from ALM onto VISp glutamatergic cell types (grey arrows) using a random forest classifier trained on VISp types, and vice versa (blue-grey arrows; Methods). The fraction of cells that mapped with high confidence onto clusters from the other region is represented by the weight of the arrows. The best matched types were used in Fig. 2c. For this comparison, the 4,519 ALM cells and 7,352 VISp cells from glutamatergic types excluding CR-Lhx5 were used. d, e, RNA ISH from the Allen Mouse Brain Atlas25 for select markers confirms areal gene expression specificity. Images contain regions of interest from representative sections selected from individual whole-brain RNA ISH experiments. The number of whole-brain experiments per gene available in the Allen Brain Atlas is as follows: Wnt7b: n = 3 brains (1 sagittal, 2 coronal); Postn: n = 2 brains (1 sagittal, 1 coronal); Rxfp2: n = 2 brains (1 sagittal, 1 coronal); Chrna6: n = 3 brains (1 sagittal, 2 coronal); Stac: n = 2 brains (1 sagittal, 1 coronal); Scnn1a: n = 2 brains (1 sagittal, 1 coronal). Brain diagrams were derived from the Allen Mouse Brain Reference Atlas (version 2 (2011); downloaded from https://brain-map.org/api/index.html).

