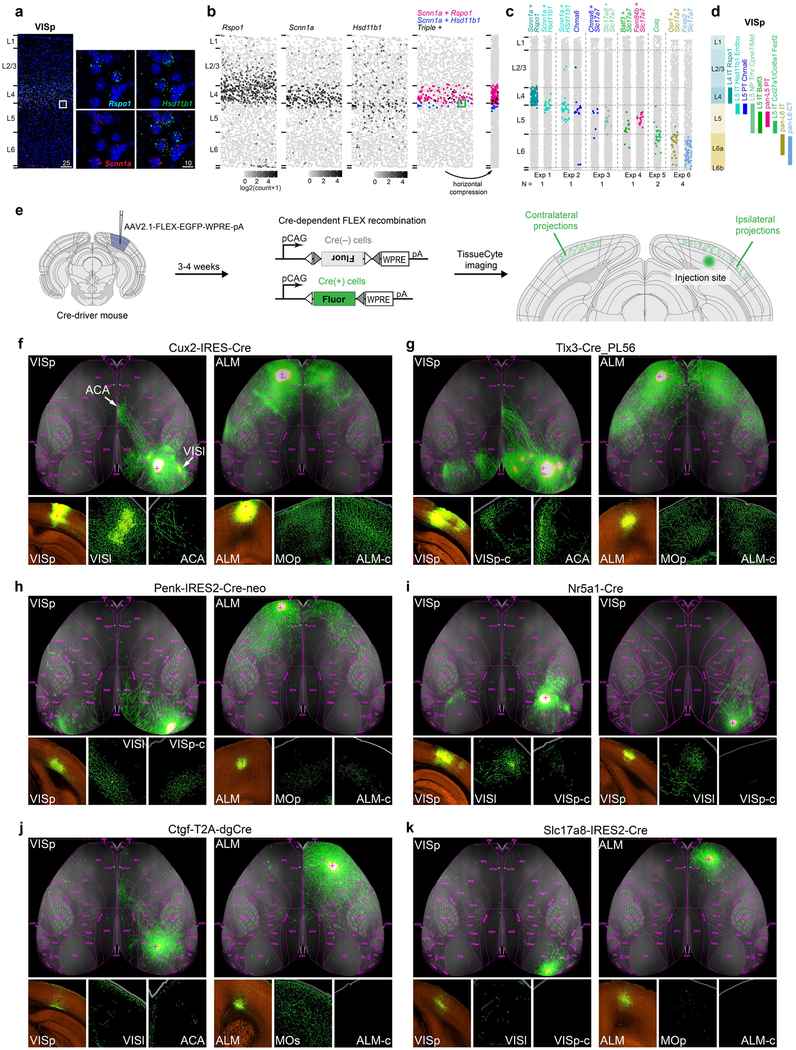
Extended Data Fig. 11 |. Validation of glutamatergic marker gene expression and cell type location by RNA FISH and projection subclasses by anterograde tracing.
a-c, Single-molecule RNA FISH with RNAscope was used to validate marker expression and cell type distribution. a, Example image shows fluorescent spots that correspond to Rspo1 (cyan), Hsd11b1 (green) and Scnn1a (red) mRNA molecules in a 10-μm coronal VISp section. Scale bars are in micrometres. b, Example of processed data from a; white square in a corresponds to green square in b. Data processing steps involved creation of maximum projection of a montage of confocal z-stacks, identifying nuclei, quantifying the number of fluorescent spots, assignment of spots to each nucleus by CellProfiler67 and horizontal compression of the data to emphasize layer enrichment of examined cells. Each dot in the panel represents a cell plotted according to the detected nucleus position. Each cell was coloured according to the quantified fluorescent labelling. The first three panels show cells shaded according to the quantified number of spots per cell: Rspo1 and Scnn1a mRNAs are enriched in L4 and Hsd11b1 at the L4-L5 border. The fourth panel shows location of cells co-labelled with two or more probes and confirms scRNA-seq data: coexpression of Rspo1 and Scnn1a is expected in the L4-IT-VISp-Rspo1 type and coexpression of Hsd11b1 and Scnn1a in the L5-IT-VISp-Hsd11b1-Endou type. c, Condensed plots for six individual representative RNA scope experiments (Exp) in VISp for select glutamatergic cell type markers. The number of times (n) each experiment was performed independently to produce similar results is listed below each experiment. Layers were delineated based on cell density. Data in a and b correspond to Exp1. d, A schematic of laminar distributions of VISp glutamatergic types according to experiments in c corroborates previous evidence85 showing that L5 IT and L5 pyramidal tract cells are not well separated into 5a and 5b sublayers in the visual cortex, compared to the primary somatosensory cortex. Note that in ALM, even subtypes of L5b with different projections are well segregated into upper and lower sublayers (see accompanying study)21. e, To confirm the projection patterns of several transcriptomic types and examine them in greater detail, we performed anterograde tracing by Cre- dependent adeno-associated virus (AAV) in select Cre lines. We have previously characterized cell type labelling by these Cre lines (Extended Data Fig. 8). In one case, we used a Cre line with a similar pattern of expression with viral reporter in adulthood (Cux2-IRES-cre instead of Cux2-IRES-creERT2)86. f-k, Each image is a projection generated from a series of images obtained by TissueCyte 1000 from a representative anterograde tracing experiment; additional experiments are available at http://connectivity.brain-map.org/. f, L5 and L2/3 IT types as labelled in Tlx3-cre_PL56, and Cux2-IRES-cre lines display extensive long-range projections that cover all layers with preference for upper layers. h, By contrast, L6 IT types, labelled by the newly generated Penk-IRES2-cre-neo line (Extended Data Fig. 8), project to many of the same areas as the L2-L3 and L5 IT types, but their projections are confined to lower layers in all areas examined, including higher visual areas and contralateral VISp and ALM. i, As revealed by the retro-seq data (Extended Data Fig. 10b), we confirm that L4-IT-VISp-Rspo1 type, which represents most cells labelled by Nr5a1-cre (Extended Data Fig. 8) projects to contralateral VISp (Fig. 3d). Notably, this projection is observed only when injection is performed in the most anterior portion of VISp (compare left and right panels in i). j, L6b types labelled by Ctgf-2A-dgcre have sparse projections to the anterior cingulate area. k, Consistent with the retro-seq data, the near-projecting types labelled by Slc17a8-IRES2-cre (Extended Data Fig. 8) do not have long-distance projections, but only local projections and sparse projections to nearby areas. Brain diagrams were derived from the Allen Mouse Brain Reference Atlas (version 2 (2011); downloaded from https://brain-map.org/api/index.html).

