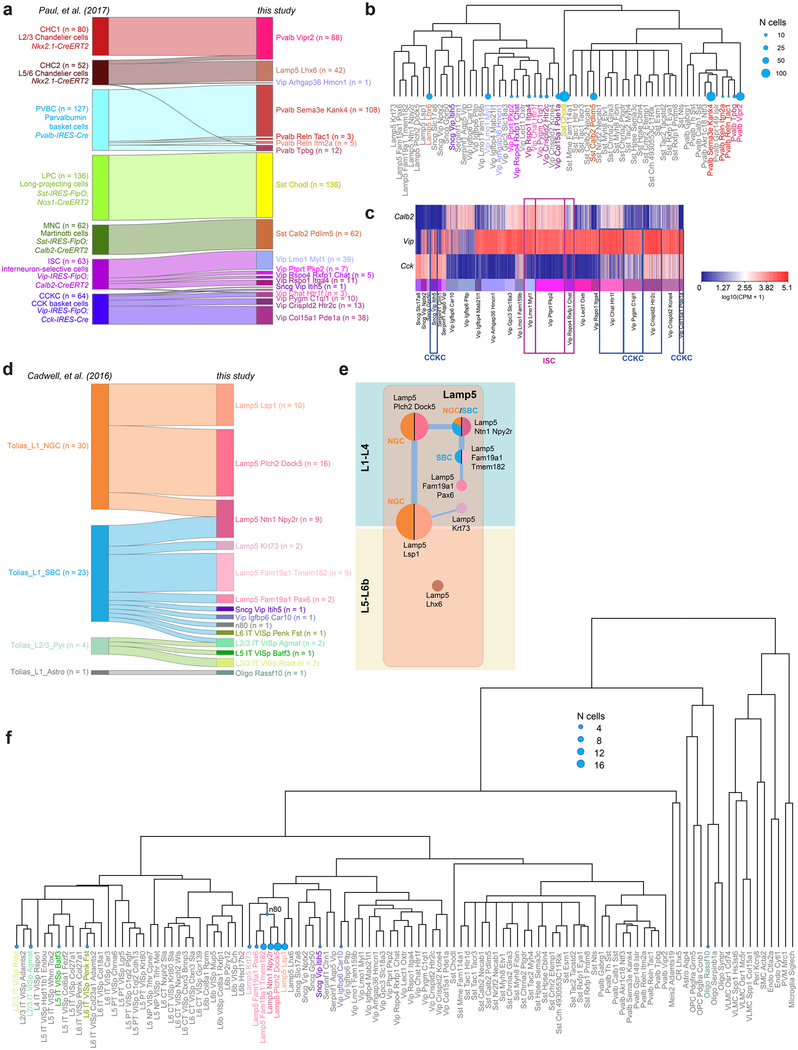
Extended Data Fig. 12 |. Mapping of previously published scRNA-seq samples36 and Patch-seq samples38 to our dataset.
scRNA-seq data obtained from sorted cells or cell content extracted by patching were mapped to our transcriptomic types using a centroid classifier (Methods). a, River plot showing the mapping of single-cell transcriptomes described previously36 (n = 584 cells) to our types. b, Alternative representation of the results in a, with blue discs representing the number of single-cell transcriptomes published previously36 onto a dendrogram of GABAergic cell types in this study. Each blue disc area represents the total number of single-cell transcriptomes mapped to one of our cell types. c, Expression of Calb2, Vip and Cck in single cells from our Sncg and Vip subclasses (n = 3,225). Transgenic recombinase lines based on these genes were used to label CCK basket cells (CCKC) and interneuron-selective cells (ISC) described previously36. Boxes highlight our types to which the CCK basket cells and interneuron-selective cells described previously36 were mapped to. CCK basket cells and interneuron-selective cells as defined previously36 each correspond to several of our transcriptomics types. d, Patch-seq data for 58 cells described previously38 were mapped to our transcriptomic types. Some cells could not be mapped with high confidence to terminal leaves of our taxonomy, and were therefore mapped to an internal node (cluster labels on the right that start with ‘n’ for node, see f). e, Constellation diagram showing corresponding types described previously38 and Lamp5 cell types from this study. Correspondences with the neurogliaform cells (NGC, orange) and single-bouquet cells (SBC, blue) defined previously38 are shown by the colours applied to the left side of each disc. f, Alternative representation of the result in d, with blue discs representing the number of single cell transcriptomes described previously38 mapped onto a dendrogram of GABAergic cell types in this study. Each blue disc area represents the total number of single cell transcriptomes mapped to a type (terminal leaf) or node in our taxonomy.

