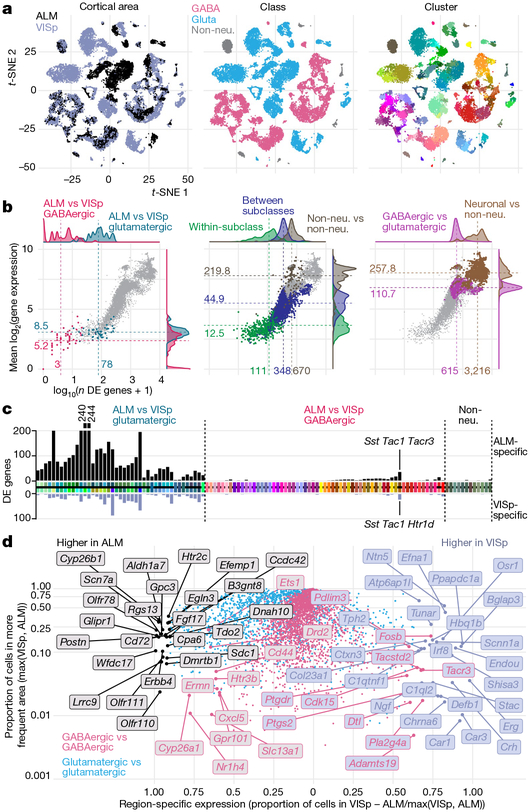
Fig. 2 |. Comparison of gene expression differences among types across cortical areas.
a, Two-dimensional t-distributed stochastic neighbour embedding (t-SNE) plots based on 4,020 differentially expressed genes for n = 23,822 cells, coloured by region, class and cluster. Most glutamatergic types are ALM- or VISp-specific. Most GABAergic types contain cells from both regions (salt-and-pepper clusters, left t-SNE). b, Number of differentially expressed (DE) genes (x axis) and mean difference in gene expression (y axis) for all 8,778 pairs of clusters. Left, comparisons between ALM and VISp portions of each GABAergic cluster (pink) and best- matched glutamatergic ALM and VISp clusters (blue). For comparison, centre and right panels show differences between: types within a subclass, types from different subclasses, non-neuronal types, types from different neuronal classes (GABA versus glutamate), and neuronal and nonneuronal types. Grey points represent all pairwise type comparisons; pink points are only in the left panel. c, Number of differentially expressed genes between best-matched ALM- and VISp-specific cell types (Extended Data Fig. 10c) or ALM and VISp portions for shared types. Cell types on the x axis are coloured as in Fig. 1; black horizontal line separates matched ALM and VISp types, but not the shared types. Black and grey bars denote the numbers of ALM- and VISp-enriched genes, respectively. d, ALM- or VISp-specific genes based on the proportion of cells in each region that express each gene, calculated separately for glutamatergic and GABAergic cells.

