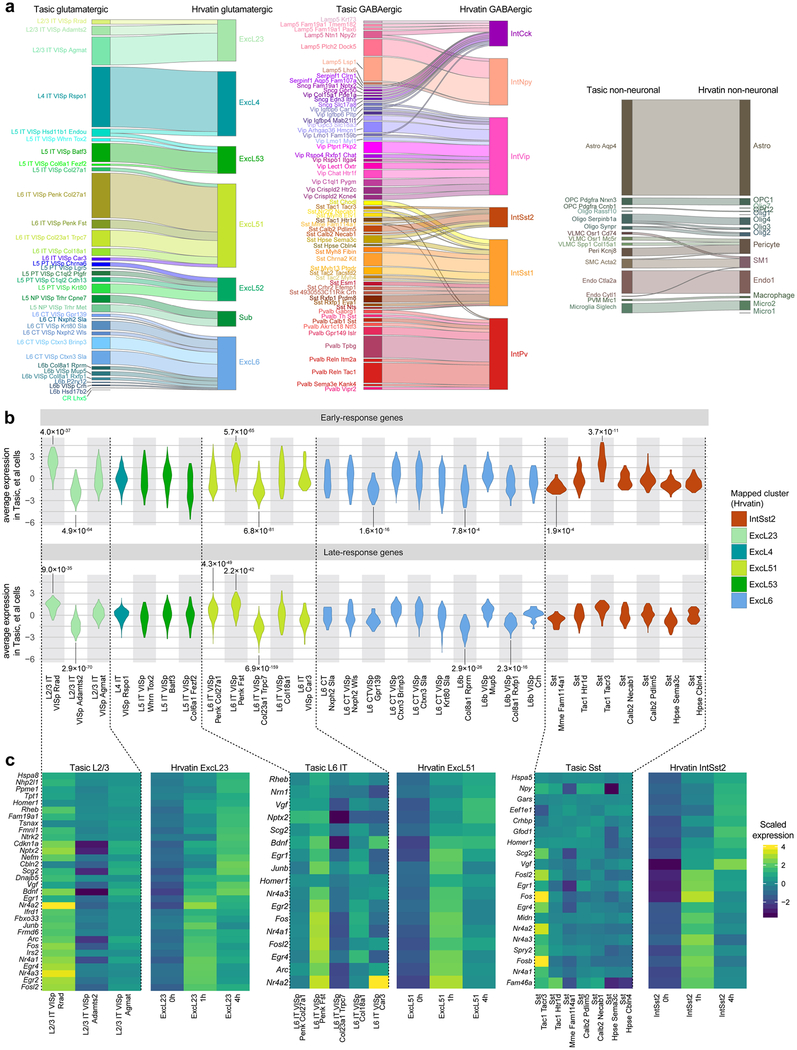
Extended Data Fig. 15 |. Cell types with activity-dependent transcriptomic signatures.
a, River plots representing the mapping of 14,205 VISp cells from this study to a previously published dataset40 using a centroid classifier (Methods). b, Violin plots show the distribution of log2-scaled and centred average expression of late-response genes (LRGs) and early-response genes (ERGs) in select cell types from this study that are in a subclass with at least one type that is significantly correlated with LRG or ERG expression. From the published dataset40, only the clusters with expression of at least four ERGs and LRGs were included. In total, values for n = 6,956 cells from our study are displayed in the violin plots. We performed a two-sided t-test to assess enrichment or depletion of expression of LRGs or ERGs, and defined significant values as P < 0.01 after correction for multiple hypotheses using the Holm method, and average fold change greater than 2. Significant P values for enrichment and depletion are displayed above and below each row, respectively. Complete statistics for all t-tests is included in Supplementary Table 11. c, Heat maps of log2-scaled and centred average gene expression for ERGs and LRGs in select cell types from our study and from the published dataset40.

