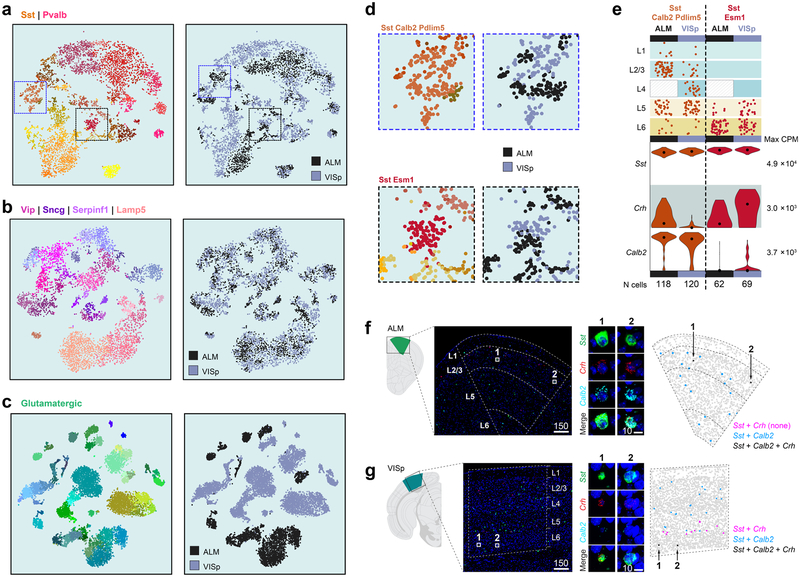
Extended Data Fig. 16 |. Areal gene expression differences in GABAergic types.
a-c, t-SNE plots for Sst and Pvalb (n = 5,113 cells, generated using 1,244 differentially expressed genes), Lamp5, Serpinf1, Sncg and Vip (n = 5,365 cells, generated using 1,184 differentially expressed genes) and glutamatergic types (n = 11,905 cells, generated using 1,984 differentially expressed genes) showing cells labelled in cluster colours on the left and area-of-origin on the right. Glutamatergic cells show the most marked segregation by area of origin. Sst and Pvalb types show small but noticeable area-specific segregation, which is even less obvious for the Lamp5, Sncg and Vip types. d, Areas from the Sst and Pvalb t-SNE plots were enlarged to show partial segregation of cells within two Sst types by area of origin. e, Layer distribution and violin plots for marker genes Sst, Crh and Calb2 in cells from the same transcriptomic type divided by area. The number of cells in each type and region are shown below each column (n = 118 cells for ALM Sst-Calb2-Pdlim5; 120 for VISp Sst-Calb2-Pdlim5; 62 for ALM Sst-Esm1; and 69 for VISp Sst-Esm1). Violin plots are shown on a logi0 scale, scaled to the maximum value for each gene (right of the plot in CPM); black dots are medians. In ALM, triple positive Sst+Crh+Calb2+ cells belong to Sst-Calb2-Pdlim5 type and are enriched in upper layers. In VISp, this same type does not express Crh, but a different type may account for Sst+Crh+Calb2+ cells: Sst-Esm1, and would be expected in lower layers. f, g, RNA FISH by RNAscope for Sst (green), Crh (red) and Calb2 (cyan) in ALM and VISp. Scale bars are in micrometres. In agreement with e, we find triple-positive cells by RNA FISH in ALM in upper layers, and in VISp in lower layers. Images are representative of a single experiment including multiple tissue sections from ALM and VISp. Brain diagrams were derived from the Allen Mouse Brain Reference Atlas (version 2 (2011); downloaded from https://brain-map.org/api/index. html).

