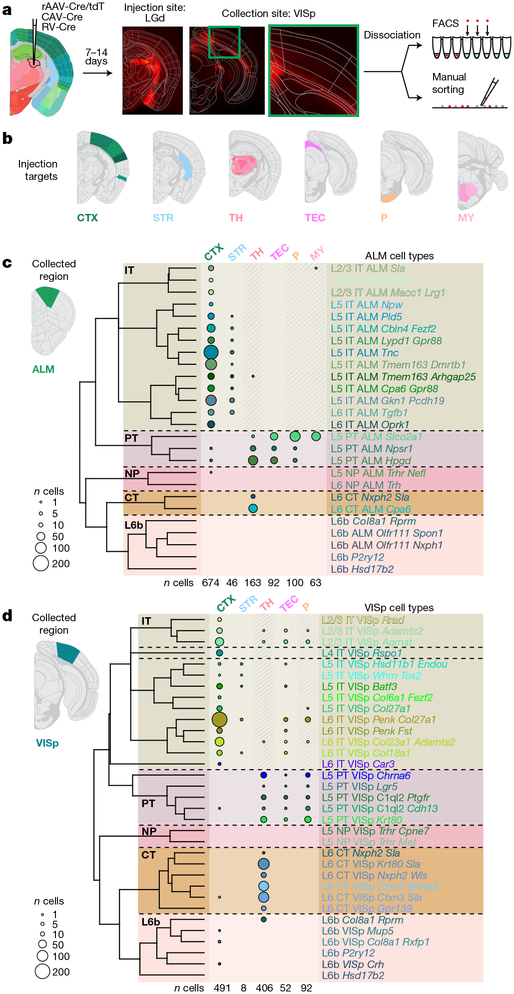
Fig. 3 |. Glutamatergic cell types by scRNA-seq and projections.
a, Retro-seq: after virus injections and brain sectioning, injection sites were imaged to determine injection specificity. Tissue was microdissected from the collection site (ALM or VISp) and processed as shown in Fig. 1b. b, Injection targets grouped into broad regions: cortex (CTX), striatum (STR), thalamus (TH), tectum (TEC), pons (P) or medulla (MY). c, Dendrogram of glutamatergic cell types in ALM followed by numbers of cells (represented by disc area) originating from retrograde labelling from regions on top. Shaded regions denote cells labelled unintentionally, directly or retrogradely through the needle (injection) tract. d, As in c, but for VISp. Only glutamatergic cells from the annotated retro-seq dataset were included: n = 1,138 out of 1,152 annotated cells in c, and 1,049 out of 1,052 annotated cells in d. See Extended Data Fig. 10a, b for further details. Brain diagrams were derived from the Allen Mouse Brain Reference Atlas (version 2 (2011); downloaded from https://brain-map.org/api/index.html).

