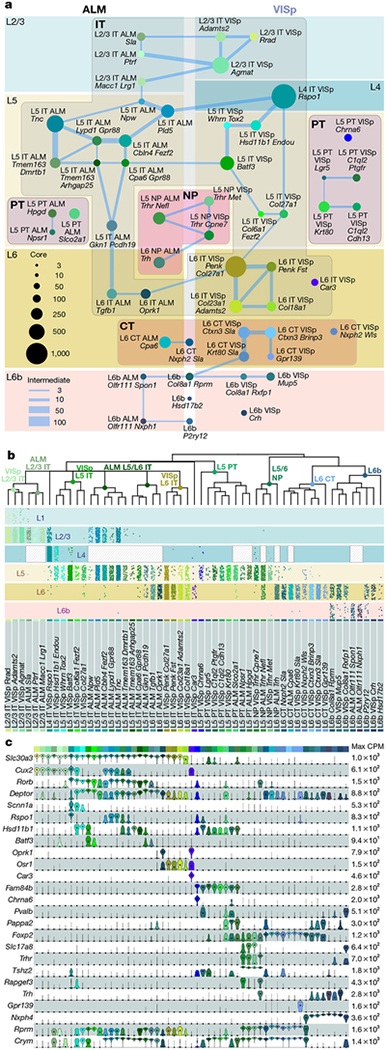
Fig. 4 |. Glutamatergic cell types and markers.
a, Constellation diagram of ALM and VISp types. Disc areas represent core cell numbers for each cluster (n = 10,729), edge weights represent intermediate cell numbers (n = 1,136). L6-CT-Nxph2-Sla, L6b-Col8a1-Rprm, L6b-Hsd17b2 and L6b-P2ry12 are found in both areas. Cajal-Retzius type was omitted. b, Dendrograms correspond to glutamatergic portion of Fig. 1c. Layer distribution for each type was inferred from layer-enriching dissections (n = 8,477 out of 11,871 cells in glutamatergic clusters): each dot represents a cell positioned at random within each layer. Distributions are approximate owing to sampling strategy (Methods). c, Marker gene expression distributions within each cluster are represented by violin plots. Rows are genes, black dots are medians. Values within each row are normalized between 0 and maximum detected, displayed on a log10 scale (n = 11,827 cells).

