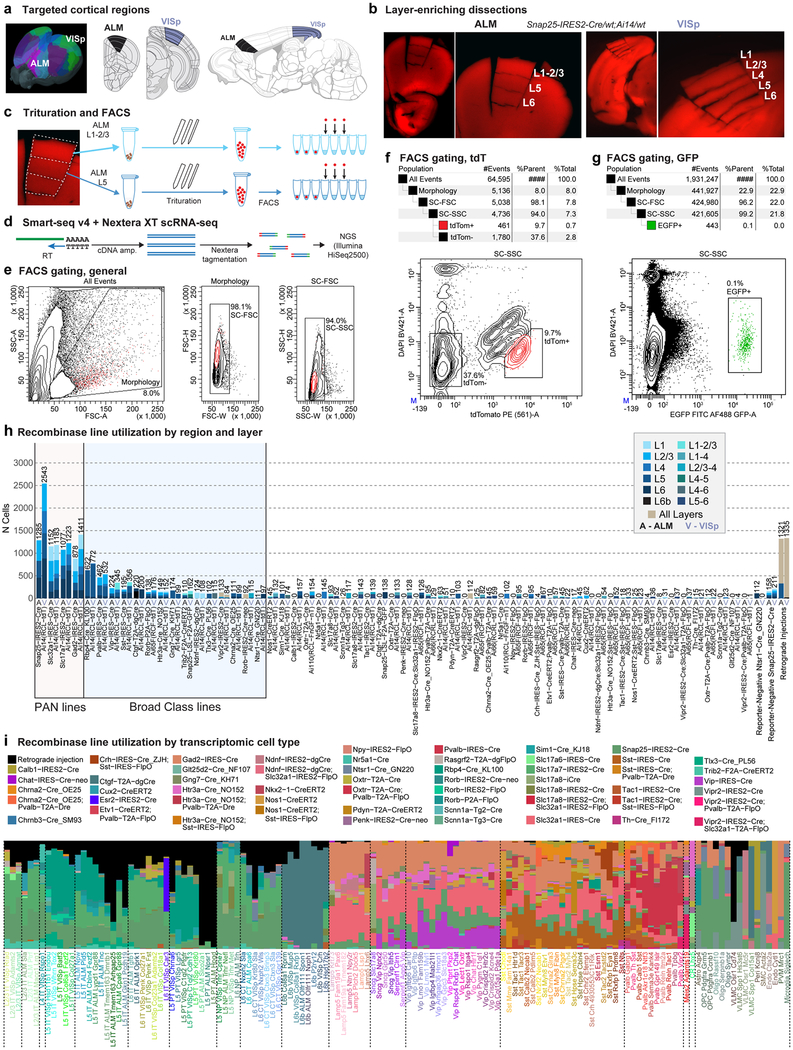
Extended Data Fig. 1 |. Overview of sample collection.
a, One of the two brain regions, ALM or VISp, was dissected from an adult mouse (P53-P59 (n = 339), P51 (n = 1), and P63-P91 (n = 12), Supplementary Table 1). b, Example microdissection images from the most heavily sampled mouse genotype, Snap25-IRES2-cre/wt;Ai14/wt, from both cortical regions. For many samples, microdissection was used to isolate layer-enriched portions of the cortex. ALM lacks L4. The dissection images are representative of n = 21 processed Snap25-IRES2-cre/wt;Ai14/wt brains. c, Microdissected layers were processed separately for single-cell suspension. Each sample was digested with pronase, then triturated with pipettes of decreasing tip diameter (600, 300 and 150 μm). Individual cells were sorted into 8-well strip PCR tubes by FACS. d, SMART-Seq v4 was used to reverse-transcribe and amplify full-length cDNAs from each cell. cDNAs were then tagmented by Nextera XT, PCR-amplified, and sequenced on Illumina HiSeq2500. e, Common gates used for all FACS sorts: (1) Morphology gate excludes events with high side scatter and low forward scatter, which are largely cellular debris, and (2) SC-FSC and SC-SSC gates exclude samples with high forward scatter width and high side scatter width, respectively, to exclude cell doublets and multiplets. f, Example gating for live tdTomato+ or tdTomato− cells. Cells sorted using the tdTom+ gate express the tdTomato reporter and have low DAPI fluorescence. This plot was generated from cell suspension isolated from a Snap25-IRES2-cre/wt;Ai14/wt animal, which expresses tdTomato in all neurons. The tdTom− gate in this genotype was the main source of non-neuronal cells, which have low DAPI fluorescence and low tdTomato expression. Gating hierarchy and sorting statistics are shown above the FACS scatter plot. This gating strategy is representative of n = 21 processed Snap25-IRES2-cre/wt;Ai14/wt brains. g, To sort eGFP+ cells, we used the same debris and doublet gating described in e, then collected cells with high eGFP and low DAPI fluorescence (eGFP+ gate). This plot was generated from cell suspension isolated from VISp of a Ctgf-2A-dgcre/wt;Snap25-LSL-F2A-GFP/wt animal, which expresses eGFP in L6b neurons. Gating hierarchy and sorting statistics are shown above the FACS scatter plot. This gating strategy is representative of n = 4 processed Ctgf-2A-dgcre/wt;Snap25-LSL-F2A-GFP/wt brains. h, Genotype and layer sampling frequencies for all cluster-assigned cells (n = 23,822). PAN Cre-lines were used to broadly sample neurons in the cortex. Non-PAN lines were included to (1) enrich for cells that displayed poor survival in the isolation process (for example, Rbp4-cre_KL100 for L5 types and Pvalb-IRES-cre for Pvalb types); (2) enrich for rare cell types (for example, Ctgf-2A-dgcre for L6b); and (3) transcriptomically characterize cell types labelled by these lines. Bar plots show the number of cells sampled from each genotype and region (A, ALM; V, VISp). Bars are coloured according to the number of samples from microdissected layers or combinations of layers. i, Transgenic driver composition with respect to cell types for all cluster-assigned cells (n = 23,822). The stacked bar plot shows the proportion of cells in each cluster that were collected from each Cre line. Black bars represent cells collected from retrograde tracing experiments. These cells were labelled by a fluorophore-expressing virus or by a Cre-expressing virus together with a Cre-reporter transgenic line. Brain diagrams were derived from the Allen Mouse Brain Reference Atlas (version 2 (2011); downloaded from https://brain-map.org/api/index.html).

