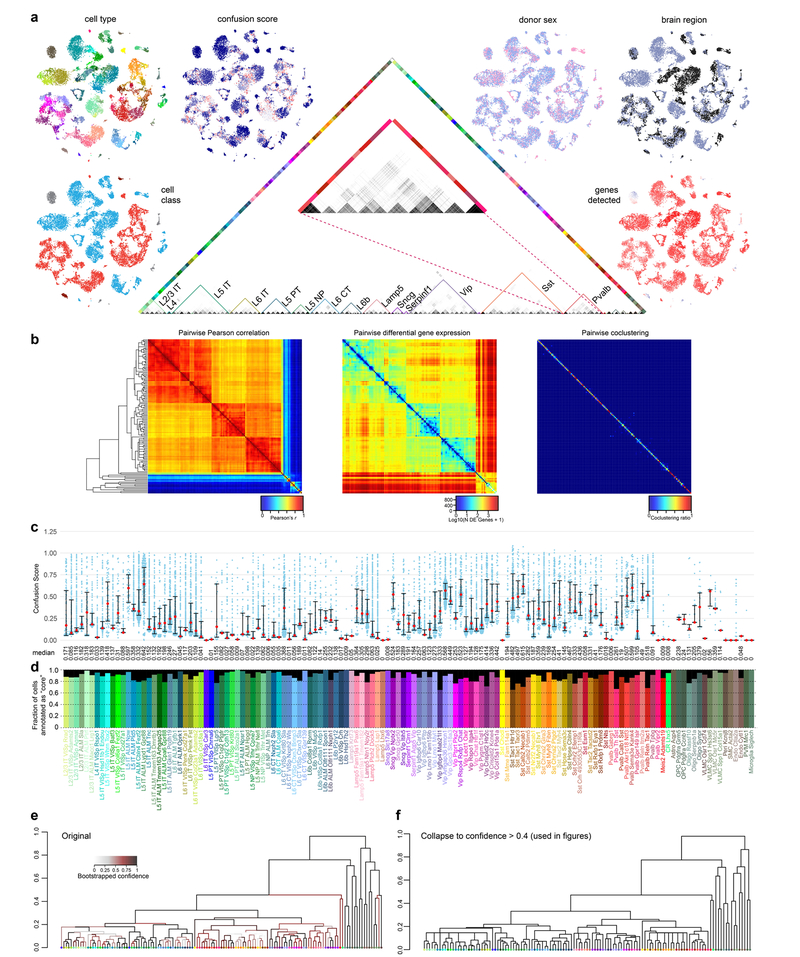
Extended Data Fig. 3 |. Co-clustering frequency matrix, confusion scores and intermediate cells.
a, The co-clustering frequency matrix (centre) for up to 100 cells per cluster selected at random (n = 10,820). Some cell types, for example certain Pvalb types (middle of enlarged panel), display pronounced co-clustering. t-SNE was used to visualize the similarity of gene expression patterns in two dimensions for all cluster- assigned cells (n = 23,822). Individual cells in t-SNE plots were coloured by: cell class (GABAergic, red; glutamatergic, blue; glia, grey; endothelial cells, brown), animal donor sex (female, pink; male, purple), dissected brain region (ALM, black; VISp, grey), confusion score (low-blue, highred), and the number of genes detected (low-blue, high-red). b, Pairwise correlation, differential gene expression and co-clustering for all 133 clusters using all cluster-assigned cells (n = 23,822). c, Confusion scores for all cluster-assigned cells (n = 23,822) segregated by clusters. For each cell, the confusion score is defined as the ratio of the probabilities for that cell to be clustered with the cells from its second best cluster and with the cells from the final cluster (also the best cluster except for rare exceptions). Thus, confusion score is a measure of the confidence of cell type assignment: the lower the value, the less frequently a cell was grouped with cells from a different cluster. Each blue dot is a confusion score for a single cell, median values are shown as red dots; whiskers are twenty-fifth and seventy-fifth percentiles. d, Fraction of cluster-assigned cells (n = 23,822) annotated as core (coloured) or intermediate (black) for each cluster. In total, 21,195 cells (88.97%) were assigned core, whereas 2,627 (11.03%) were assigned intermediate identity. e, f, We performed 100 rounds of bootstrapped clustering to determine the confidence of our hierarchical clustering structure (Methods). The final dendrogram generated by this method (e), with branches coloured by their bootstrapped confidence: light grey (low confidence), maroon (moderate confidence), and black (high confidence). For figures, we used the dendrogram in f, in which we collapsed branches with confidence lower than 0.4.

