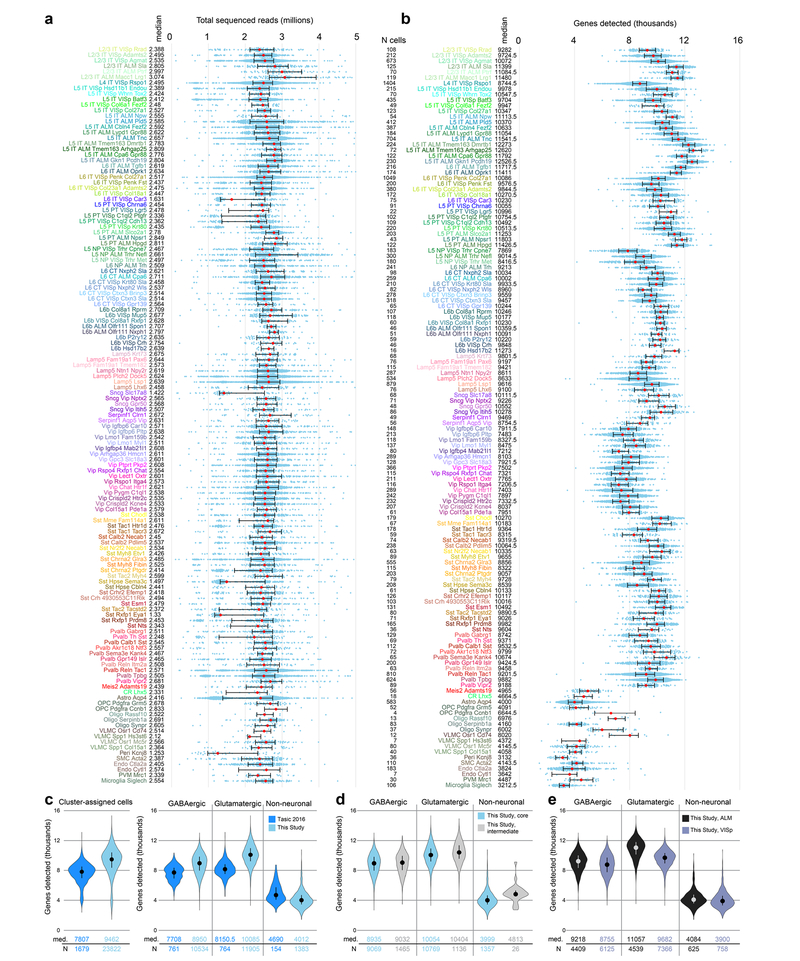
Extended Data Fig. 4 |. Sequencing depth and gene detection for quality-control-qualified cells segregated by cluster.
a, Sequencing depth for all cluster-assigned cells (n = 23,822), grouped by cell type. Cells were sequenced to a median depth of 2.54 million reads (min = 0.103 M; max = 13.84 M). Median values in millions of reads are adjacent to the cell type labels. Median values are shown as red dots; whiskers are twenty-fifth and seventy-fifth percentiles. b, The number of detected genes (reads detected in exons >0) varies by cell type. Gene detection is shown for each cluster-assigned cell (n = 23,822). Median values are shown adjacent to the cell type labels. Median number of genes detected across all cells is 9,462 per cell (min = 1,445; max = 15,338). Median values are shown as red dots; whiskers are twenty-fifth and seventy-fifth percentiles. Samples with less than1,000 detected genes were excluded at a prior quality control step (Extended Data Fig. 2). c, Comparison of gene detection between our previous study20 and this study for all cluster-assigned cells (left) and cells grouped according to major classes (right). d, Comparison of gene detection between cell classes for core and intermediate cells. The higher gene detection for intermediate non-neuronal cells may be due to contamination with other non-neuronal cells. e, Comparison of gene detection within cell classes between VISp and ALM. In c-e, medians are shown as dots and values are listed below each distribution; whiskers are twenty-fifth and seventy-fifth percentiles. Sample size (number of cells) for each analysed group is listed between panels a and b, and below the graphs for panels c-e.

