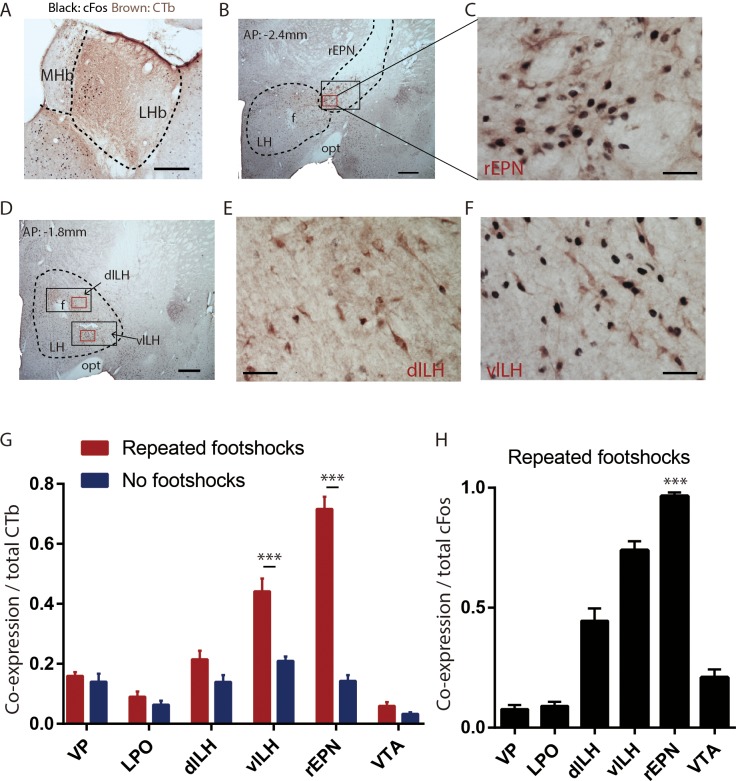
Figure 1. LHb-projecting neurons in the rEPN and the LH are significantly activated by repeated footshocks.
(A) Representative photos of CTb injection site in LHb (brown immunoreactive product). Representative photos of CTb immunostaining (brown) and shock-induced cFos (black) in the rEPN (B, C) and the LH (D–F). Black squares: areas for cFos counting. Red squares: areas enlarged in representative images. f: fornix; opt: optic tract; MHb: medial habenula. (G) Proportion of CTb-labeled neurons expressing cFos in the VTA, rEPN, dlLH, vlLH, LPO, and VP, showing the largest shock-induced increases in the rEPN and LH. (E) Proportion of cFos neurons expressing CTb in these same regions. Scalebars 250 µm (A), 500 µm (B, D), 100 µm (C, E and F).

